Published: 11 July 2013
Households’ net financial assets decreased in 2012
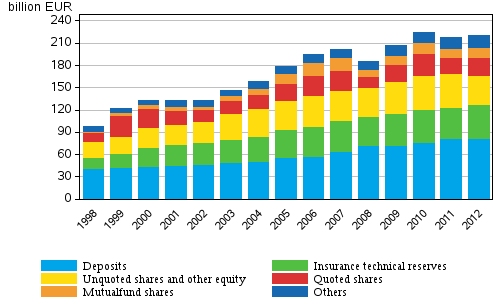
Households' financial assets stood at EUR 220.2 billion at the end of 2012. Financial assets grew only by EUR 2.5 billion during the year. While liabilities correspondingly grew by EUR 6.4 billion to EUR 132.6 billion, households' net financial assets decreased to EUR 87.6 billion. These data derive from Statistics Finland’s Financial Accounts statistics.
Financial assets of households 1998-2012, EUR billion

.
From fixed-term deposits to cash deposits
At the end of 2012, over EUR 80 billion, or 36 per cent of households' financial assets were deposits. Even though the total amount of deposits remained practically unchanged during the year, there was a clear shift from fixed-term deposits to cash deposits. At the end of 2012, EUR 46 billion of households' financial assets were insurance technical reserves, EUR 39 billion unquoted shares and equity, EUR 24 billion quoted shares and EUR 14 billion mutual fund shares. Households' net investments both in quoted shares and investment funds increased slightly from the year before.
Indebtedness rate went up
Households' loan debts stood at EUR 123.4 billion at the end of 2012. Loan debts grew by altogether EUR 6.1 billion during 2012, which resulted in households' indebtedness increasing by 2.5 percentage points to 118.2 per cent. Households' indebtedness is calculated as the ratio of their loan debts at the end of the year to their total disposable income of the year.
Source: Financial Accounts, Statistics Finland
Inquiries: Martti Pykäri 09 1734 3382, rahoitus.tilinpito@stat.fi
Director in charge: Leena Storgårds
Publication in pdf-format (418.1 kB)
- Reviews
- Tables
-
Tables in databases
Pick the data you need into tables, view the data as graphs, or download the data for your use.
Appendix tables
- Appendix table 1. Financial assets of households, million EUR (11.7.2013)
- Appendix table 2. Liabilities of households, million EUR (11.7.2013)
- Appendix table 3. Households´ net acquisition of financial assets, million EUR (11.7.2013)
- Appendix table 4. Households´ net incurrence of liabilities, million EUR (11.7.2013)
- Appendix table 5. Financial assets of Non-financial corporations, million EUR (11.7.2013)
- Appendix table 6. Financial liabilities of Non-financial corporations, million EUR (11.7.2013)
- Appendix table 7. Net financial assets by sector, million EUR (11.7.2013)
- Appendix table 8. Net financial transactions by sector, million EUR (11.7.2013)
- Appendix table 9. Statistical discrepancy by sector, million EUR (11.7.2013)
- Figures
-
- Appendix figure 1. Financial assets of households, EUR billion (11.7.2013)
- Appendix figure 2. Change in financial assets of households, EUR billion (11.7.2013)
- Appendix figure 3. Households' net acquisition of deposits, quoted shares and mutal funds, EUR billion (11.7.2013)
- Appendix figure 4. Emissions of quoted shares, EUR billion (11.7.2013)
- Appendix figure 5. Households indebtedness ratio (11.7.2013)
- Appendix figure 6. Private sector debt as percentage of GDP (11.7.2013)
Updated 11.7.2013
Official Statistics of Finland (OSF):
Financial accounts [e-publication].
ISSN=1458-8145. 2012. Helsinki: Statistics Finland [referred: 20.4.2025].
Access method: http://stat.fi/til/rtp/2012/rtp_2012_2013-07-11_tie_001_en.html

