1. Strong growth in households’ financial assets continued for the sixth year in a row
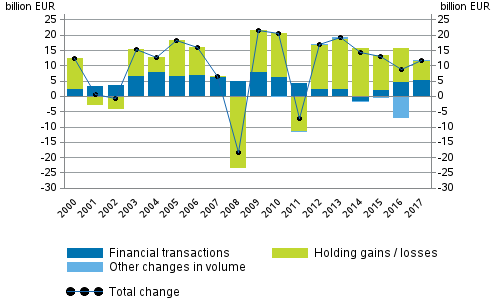
Households’ financial assets grew by almost EUR 12 billion during 2017, rising to EUR 302 billion. For the sixth year in a row, a larger part of the growth in households’ financial assets came from holding gains than from new investments in financial assets. Holding gains are particularly affected by the favourable value development of share investments. In 2017, EUR six billion were generated in holding gains, while households’ net investments in financial assets amounted to EUR five billion.
The development of households’ net financial assets was also positive in 2017. Households’ liabilities increased by nearly EUR seven billion. The difference between financial assets and liabilities was EUR 139 billion. Over the year, net financial assets grew by close on EUR five billion.
Figure 1. Change in financial assets of households, EUR billion

Households’ net investments in financial assets grew slightly compared with the previous year. New investments flowed most to deposits, to the net value of EUR three billion. The transition from fixed-term deposits to cash deposits continued for the sixth successive year. Households withdrew EUR one and a half billion from fixed-term deposits in 2017, at the same time as their transferable deposits increased by EUR four billion. Households’ net investments in mutual fund shares amounted to EUR 1.4 billion and net investment flow in quoted shares to EUR 0.3 billion.
The value of unquoted shares and equity held by households rose by EUR 2.7 billion. Households received EUR two billion in holding gains and also in a value increase of quoted shares, as well as EUR 1.2 billion in mutual fund shares.
Overall, households’ financial assets amounted to EUR 302 billion at the end of 2017. Of these, EUR 86 billion were deposits, EUR 79 billion unquoted shares and equity, EUR 58 billion insurance and pension technical reserves, EUR 38 billion quoted shares, and EUR 24 billion mutual fund shares. The value of other financial assets held by households was EUR 17 billion. Households’ shares in limited liability housing companies are not included in households’ financial assets in the financial accounts but they are part of non-financial assets.
The growth rate of households’ liabilities continued nearly unchanged. The amount of housing loans and other loan debts grew over the year by nearly EUR six billion, rising to EUR 148 billion at the end of the year. Households' indebtedness ratio, or the proportion of loan debts relative to their total disposable income in the four latest quarters, rose by 2.6 percentage points to 128.9 per cent. In this connection, loan debts are not compared to financial assets or total assets but to disposable income.
1.1. General government’s financial position improved considerably
General government's financial position improved considerably in 2017. Net financial assets rose to EUR 131 billion, which is EUR 16 billion more than one year before. The improved financial position is explained by an increase of EUR 11 billion in the net financial assets of employment pension schemes that belong to social security funds. At the same time, the net financial assets of central government grew by EUR three billion and the net financial assets of the local government sector and other social security funds grew in total by EUR two billion. The growth is influenced by significant holding gains from shares and mutual fund shares.
The weakening of central government’s net financial position that started in 2008 ended during 2017. At the end of the year, the level of central government's net financial assets stood at EUR -64 billion, which is EUR three billion more than at the end of 2016. The growth of net financial assets was based on holding gains of nearly EUR five billion from shares, thanks to the particularly favourable development of central government's portfolio.
The net financial position of local government turned upwards during 2017. The net financial position turned negative in 2012 and reached rock bottom in 2016. At the end of 2017, the level of local government's net financial assets was EUR -2.8 billion.
Employment pension schemes' financial assets exceeded the threshold of EUR 200 billion in 2017. At the end of the year, the value of employment pension schemes’ financial assets was EUR 206 billion. At the same time, liabilities taken into account in financial accounts amounted to EUR 10 billion, so the amount of employment pension schemes’ net financial assets was EUR 196 billion. Net financial assets went up by EUR 11 billion from the previous year. EUR 5.7 billion more assets were invested in mutual fund shares on net, in addition to which their market value rose by EUR 2.6 billion. Nearly one-half of employment pension schemes’ financial assets are tied to fund shares. Direct investments in shares also generated holding losses of EUR 2.6 billion. Assets flowed to deposits on net to the tune of EUR 2.9 billion during 2017, but the investment flow of debt security investments and lending remained negative and they produced some holding losses.
The net financial position of other social security funds also improved, by EUR 0.7 billion from the previous year. The level of net financial assets was EUR two billion at the end of 2017. EUR 0.3 billion more assets flowed to deposits on net, in addition to which the total amount of debt securities issued by social security funds on the market fell by EUR 0.1 billion and their investments in debt securities issued by others grew by the same amount.
1.2. Non-financial corporations increased debt financing
Non-financial corporations' debt financing increased by EUR 12 billion during 2017. Debt financing refers to the total of loan debts and financing in the form of debt securities. Over the year, non-financial corporations' debt financing grew from EUR 229 billion to EUR 241 billion. The growth came entirely from loans, because financing in the form of debt securities went down by around EUR 1.5 billion. Here, the non-financial corporations sector does not include housing companies or other housing corporations.
1.3. Growth in domestic mutual funds continued further
The brisk growth in domestic mutual funds continued for the sixth year in a row. The growth in 2017 amounted to over EUR 14 billion. Around EUR ten billion of the growth was generated through net investments and the remaining EUR four billion consisted of holding gains from funds. Especially foreign bodies invested in domestic mutual funds during 2017.
1.4. Liabilities of insurance corporations growing
Insurance corporations’ insurance and pension liabilities grew by EUR two1.8 billion to EUR 62 billion. The growth is due to the increase in liabilities based on life insurance and annuity, because non-life insurance technical reserve and pension liabilities remained on level with 2016.
Insurance corporations’ financial assets rose from EUR 74 billion to EUR 76 billion. In particular, investments in mutual funds grew significantly, from EUR 37 billion to EUR 41 billion. Mutual fund shares corresponded to 54 per cent of insurance corporations’ financial assets, while at the end of 2016, their share was 51 per cent. Insurance corporations held long-term debt securities to the tune of EUR 17 billion, which is EUR four billion less than one year ago. In turn, long-term loan receivables grew from EUR two billion to EUR five billion. Company restructurings made in Finland’s insurance sector in 2017 explain part of the changes in debt security and loan assets.
1.5. Foreign investments to Finland increased
Net investments to Finland by foreign bodies increased by EUR 42 billion in 2017. The most significant rises were seen in deposits, EUR ten billion, and in derivatives, EUR eight billion. Changes in deposit assets and liabilities are mainly linked to operations between resident and non-resident financial institutions. Other investment targets favoured by foreign bodies are such as debt securities, shares and other equity and funds.
Foreign investors increased further their holdings in Finnish quoted shares last year. A total of EUR six billion in foreign money flowed to them. The rate slowed down to one-half of the previous year’s EUR 12 billion. At the end of the year, the value of foreign share holdings in Finnish quoted shares was EUR 108 billion. The proportion of foreign ownership of the value of Finnish quoted shares was slightly under 50 per cent.
Of foreign investment instruments, particularly mutual fund shares were favoured by Finns in 2017. Finns owned EUR 128 billion in foreign investment fund shares while the level for domestic investment fund shares was EUR 103 billion. Finnish units held nearly EUR 72 billion in foreign quoted shares at the end of the year. Finnish units’ level of holdings in domestic quoted shares stood at EUR 104 billion.
1.6. Private sector debt increased
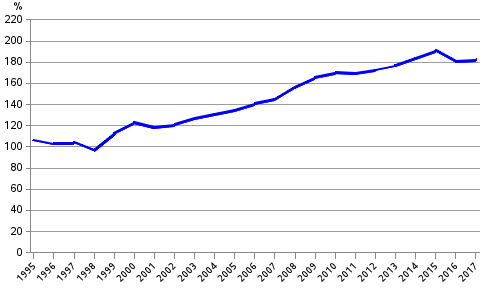
Private sector debt increased by EUR 18 billion during 2017. Simultaneously, the GDP share of the debt rose by 1.8 percentage points to 182.4 per cent. Private sector debt comprises the loan debts and debts in the form of debt securities of non-financial corporations, households and non-profit institutions serving households.
Figure 2. Non-consolidated private sector debt as percentage of GDP

�
Source: Financial Accounts, Statistics Finland
Inquiries: Henna Laasonen 029 551 3303, Timo Ristim�ki 029 551 2324, rahoitus.tilinpito@stat.fi
Director in charge: Ville Vertanen
Updated 28.9.2018
Official Statistics of Finland (OSF):
Financial accounts [e-publication].
ISSN=1458-8145. 2017,
1. Strong growth in households’ financial assets continued for the sixth year in a row
. Helsinki: Statistics Finland [referred: 19.4.2025].
Access method: http://stat.fi/til/rtp/2017/rtp_2017_2018-09-28_kat_001_en.html

