Production of electricity and heat in 2006
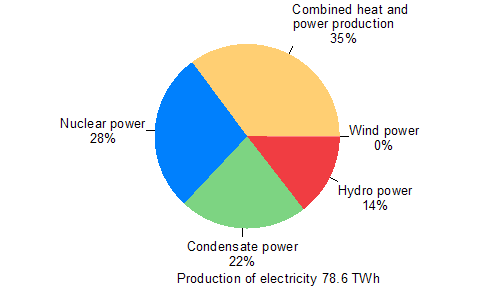
According to Statistics Finland's statistics on production of electricity and heat, electricity produced in Finland amounted to 78.6 terawatt hours (TWh) or billion kilowatt hours (kWh) in 2006. The volume of electricity produced was 16 per cent higher than one year previously. District heat production totalled 33.6 TWh, and showed an increase of 3 per cent. In 2006, industrial heat production totalled of 63.3 TWh, which was 12 per cent up from the year before.
Production of electricity and heat by production mode in 2006
| Electricity | District heat | Industrial heat | Total fuels used1 | ||
| TWh | TWh | TWh | PJ | ||
| Separate production of electricity | |||||
| Hydro power | 11.3 | - | - | - | |
| Wind power | 0.2 | - | - | - | |
| Nuclear power | 22.0 | - | - | - | |
| Condensate power2 | 17.6 | - | - | 170.7 | |
| Total | 51.0 | - | - | 170.7 | |
| Combined heat and power production | 27.6 |
25.9 |
50.3 |
461.9 |
|
| Separate heat production | - | 7.7 | 13.0 | 84.5 | |
| Total | 78.6 | 33.6 | 63.3 | 717.0 | |
1) In calculating total primary energy
used, hydro power and wind power are made commensurate
with fuels according to directly obtained electricity (3.6
PJ/TWh).
Total nuclear energy used is calculated at the efficiency ratio of
33 per cent from
produced nuclear power (10.91 PJ/TWh).
2) Condensate power refers to separate production of electricity by fuels. It includes both the electricity produced at condensing power plants and the condensate electricity produced at energy and heat generation plants.
Production of electricity
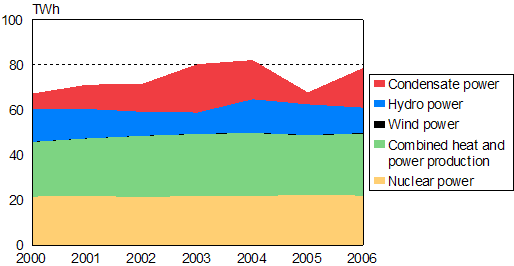
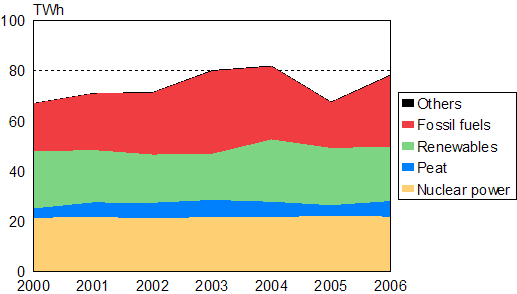
In 2006, production of electricity rose close to the level of 2004. In 2005, exceptionally large volumes of electricity were imported and relatively small volumes of electricity were produced in Finland. In terms of water, the year 2006 was worse than usual for all Nordic countries, which made it necessary to increase production of electricity in Finland. Therefore, Finland was a net exporter of electricity on the Nordic market in 2006.
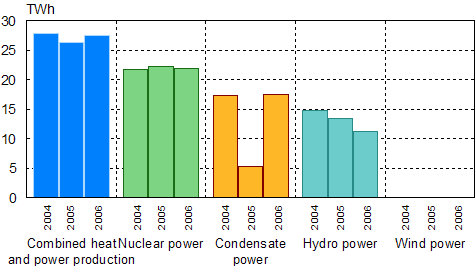
Combined heat and power production accounted for 35 per cent of the electricity produced in 2006. This mode of production increased by 5 per cent form the year before and nearly reached the level of 2004. The volume of electricity produced by nuclear power fell by 2 per cent, but this production mode remained the second most used, even if its proportion of electricity production fell from 33 to 28 per cent. The trebling of the production of condensate electricity pushed the proportion of condensate power up to 22 per cent. The production of hydro power fell by 17 per cent due to a bad water year, which lowered its proportion of the production of electricity to 14 per cent. The production of wind power was also down from the previous years; the fall amounted to 9 per cent. The proportion of wind power of total electricity produced fell back to 0.2 per cent.
Electricity production by production mode 2000-2006
Electricity production by production mode 2006
Electricity production by production mode 2004-2006
The production of electricity by fuels grew to nearly one-and-a-half times that of 2005. This was due to the decrease in the production of electricity by nuclear power, hydro power and wind power and the general increase in domestic production. The highest growth, as much as 137 per cent, was in electricity produced with coal. The volume of electricity produced with peat grew by 48 per cent and that of electricity produced with other energy sources grew by 30 per cent. Other energy sources include e.g. hydrogen and reaction heat. Electricity produced with black liquor from the forest industry grew by 17 per cent and that produced with other wood fuels grew by 10 per cent. However, because of the decrease in hydro power production volumes, the volume of electricity produced with renewable energy sources fell by 5 per cent.
Electricity production by energy source 2000-2006
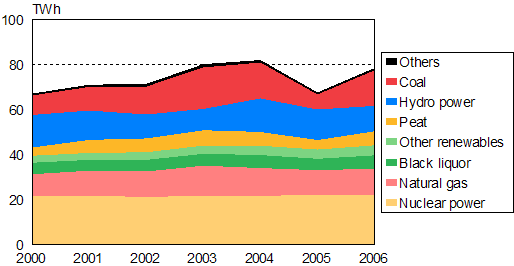
Electricity production by energy type 2000-2006
Production of heat
The demand for heating energy remained roughly on level with the previous year. The years 2005 and 2006 were both warmer than average. The production of district heat, however, grew by roughly 3 per cent in 2006 and the production of industrial heat by as much as 12 per cent, because it had been at an exceptionally low level in 2005 due to the industrial action in the forest industry, among other things.
Production of heat 2000-2006
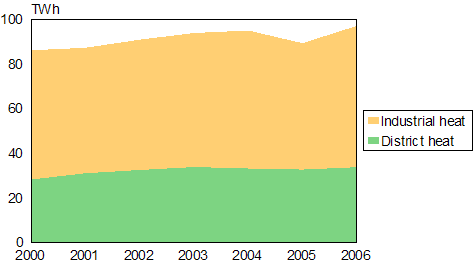
In 2006, seventy-seven per cent of district heat was produced in combined heat and power production. The proportion of combined heat and power production of industrial heat was 79 per cent.
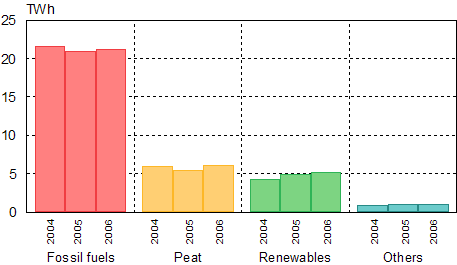
The highest volume of district heat was produced by natural gas and coal. Renewable energy sources produced 15 per cent and peat produced 18 per cent of district heat.
District heat production by fuel 2004-2006
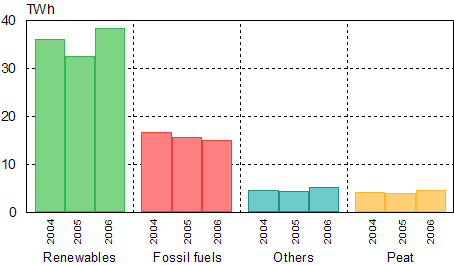
The biggest source of industrial heat was black liquor from the forest industry. The proportion of industrial heat produced by black liquor rose by 21 per cent and reached a total of 42 per cent. In total, renewable fuels produced 60 per cent of industrial heat. Among the fossil fuels, natural gas produced the most industrial heat, namely 12 per cent.
Industrial heat production by fuel 2004-2006
Use of fuels in production of energy
Use of fuels in the production of electricity and heat increased by 26 per cent. The growth was due to the higher demand for domestic production of electricity than in the year before. The water situation in the Nordic countries was better in 2005 than in 2006, and so new imports of electricity were at an exceptionally high level. In addition, the industrial action in the forest industry in 2005 reduced the forest industry's own energy need and the energy production in the forest industry. In 2005, less electricity was produced in Finland than in 2004, and consequently the volume of fuels used was lower. In 2006 the use of fuels returned roughly to the level of 2004.
Use of coal in electricity and heat production nearly doubled. Coal became the biggest fuel before black liquor from the forest industry, natural gas and other wood fuels. Use of peat increased by 35 per cent, and that of black liquor from the forest industry by 18 per cent. The use of other fossil fuels fell by 13 per cent, and that of other renewable fuels by 10 per cent. Among these fuels, recovered fuels are the biggest fuel. The use of recovered fuels decreased, as the EU's Waste Incineration Directive entered into force at the beginning of 2006, as regards old incineration plants. According to the Directive, among other things, the obligation for continuous monitoring of emissions. Old plants do not necessarily have such measuring equipment. Some plants have, therefore, completely stopped using recovered fuels.
The use of fossil fuels in the production of electricity and heat rose to 48 per cent, while the use of renewable fuels fell to 36 per cent. The proportion of peat remained roughly unchanged at 13 per cent.
Use of fuels in production of electricity and heat 2004-2006
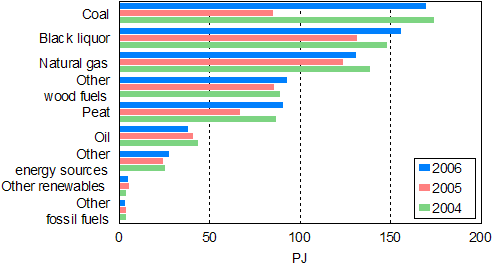
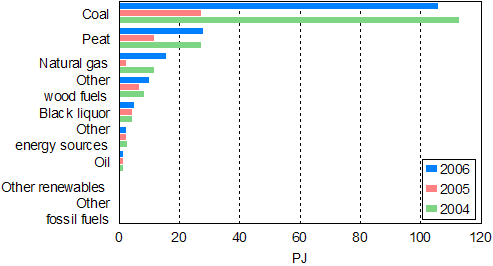
The use of fuels in separate production of electricity tripled in 2006.
The use of fossil fuels in separate production of electricity rose to 73 per cent, while the proportion of renewable fuels dropped to 9 per cent. The proportion of peat decreased to 16 per cent.
Use of fuels in separate production of electricity 2004-2006
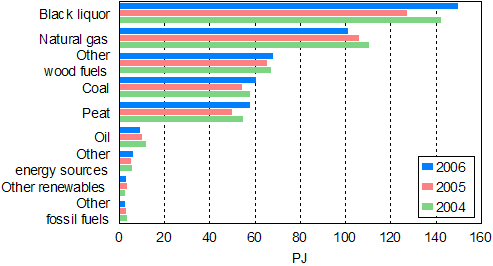
The use of fuels in combined heat and power production grew by 8 per cent from the year before.
Because of the own energy production of the forest industry, black liquor remains the biggest fuel in combined production. The proportion of black liquor of fuels used is 33 per cent. The proportion of renewable fuels, including black liquor and wood, in combined heat and power production reached nearly one-half; in 2006 their proportion was 48 per cent. The use of fossil fuels totalled to 38 per cent.
Information on the division of fuels for combined heat and power production between the production of power and heat is published in the Energy Statistics Yearbook.
Use of fuels in combined heat and power production 2004-2006
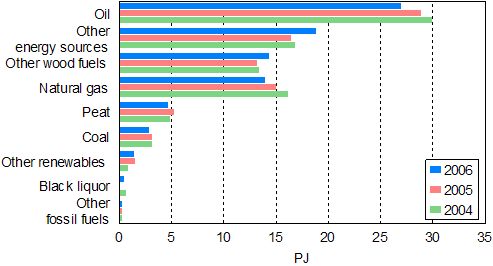
The total volume of fuels in separate production of heat remained nearly unchanged. In the separate production of heat, fuels behaved differently from other production modes, namely they do not show the fall during the year 2005.
In the separate production of heat, 52 per cent of the fuels used were fossil and 20 per cent were renewable. The proportion of peat was 6 per cent.
Only the producers of heat included in Statistics Finland's inquiry are included in the data on separate production of heat. Data are missing e.g. from small municipal heating plants and small boilers in industry.
Use of fuels in separate production of heat 2004-2006
Last updated 18.10.2007
Official Statistics of Finland (OSF):
Production of electricity and heat [e-publication].
ISSN=1798-5099. 2006,
Production of electricity and heat in 2006
. Helsinki: Statistics Finland [referred: 20.4.2025].
Access method: http://stat.fi/til/salatuo/2006/salatuo_2006_2007-10-18_kat_001_en.html

