Published: 14 November 2019
Decline in the total marriage rate accelerated
According to Statistics Finland, the decline in the total marriage rate strengthened in 2018. Examined by the whole country, the direction of the marriage rate of opposite-sex couples has been declining for over a decade. In recent years, the decrease in the marriage rate has been slowed down by the remarriage rate remaining unchanged. In 2018, the remarriage rate also decreased and as the rate of first marriages continued declining, the total marriage rate fell more steeply than before. The figure shows the development of the marriage rates for women as they are the same as for men. The figures calculated based on men are simply higher than those for women.
Marriage rate¹, first marriage rate² and remarriage rate³ 1990–2018, opposite-sex couples
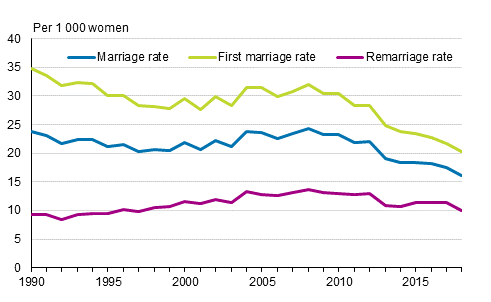
1. Married women per 1,000 non-married women and women not in a registered partnership of respective mean population aged 15 and over.
2. First marriages of women per 1,000 single women of respective mean population aged 15 or over.
3. Remarried women per 1,000 previously married women of respective mean population. In 2018, the number of women getting remarried decreased by 750 and that of men by 900 from the previous year, being 5,500 marriages for women and 5,600 for men. In the last good 10 years, the annual changes in remarriages have usually been small in absolute numbers, except the above-mentioned change in 2018 and prior to this in 2013, when the number of remarried women decreased by 1,100 and, correspondingly, for men by 1,000.
Remarriage rate also made a downturn
For women, the share of first marriages in all marriages contracted was 75 per cent in 2018. The share has remained at 75 to 77 per cent throughout the 2000s. Thus, the weight of first marriages in the development of the total marriage rate is high and largely dictates its direction. Usually, the remarriage rate only evens out the downward trend or strengthens it. In 2018, the remarriage rate declined, which strengthened the drop in the total marriage rate.
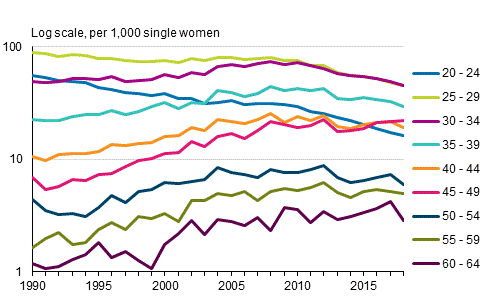
The average age of persons entering into their first marriage has been on the rise for a long time, which means that getting married is moving to an ever older age. In 2018, the rise in the average ages that had continued for years stopped for both sexes. The fact that the age of persons entering into their first marriage is rising is clearly visible in the development of marriage rates by age groups concerning first marriages: the marriage rate for those aged 20 to 34 has still declined in recent years. The development in marriage rate for these age groups pushes the total marriage rate to decline, too.
In 1990, seventy-four per cent of women who entered into first marriage were aged 20 to 34 and in 2018, the share was only 55 per cent. The development is similar for men in the same age group, the share decreased from 88 to 65 per cent.
In 1990, the share of women, who entered into their first marriage at the age of 35 or older, was six per cent of the first marriages entered into, and in 2018, the share had grown to 25 per cent, remaining the same as in the year before. The corresponding share for men increased from 10 per cent to 34. These increasing shares can also be seen as growing trends of marriage rates by age group concerning first marriages for persons aged 35 or older. In 2018, the growth in marriages in the older age groups stalled, however, and was smaller than in the year before.
Even though the marriage rate for first marriages has been rising considerably in relative terms in older age groups, the number of marriages entered into is not high: 490 first marriages for women aged 50 to 64, which corresponds with three per cent of all first marriages entered into in 2018. This share is the same as in the previous year.
First marriage rate of woman by age 1990–2018, opposite-sex couples
Marriage rate decreased in all educational groups
In the 2000s, the marriage rate was at its highest in 2008, after which the rate has been declining. Even though there are differences in the marriage rate between educational groups, the decline in the marriage rate seems to have developed in the same way in all educational groups until 2018. The development in men’s marriage rate by educational groups is similar as that of women but the marriage rate is higher, see Appendix figure 1.
The data only apply to women and men born in Finland. Some qualifications taken abroad are missing from Statistics Finland's Register of Completed Education and Degrees, for which reason the qualification data of many persons born abroad are deficient.
Marriage rate¹ of women born in Finland by level of education in 2008 to 2018, opposite-sex couples
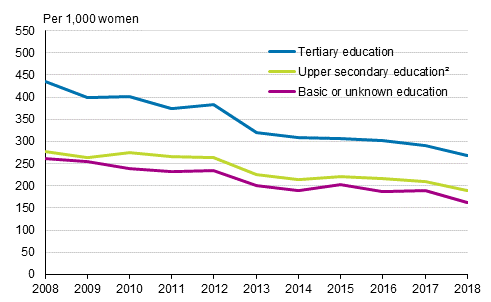
1. Sum of marriage rates by 5-year age groups of women aged 20 to 64 multiplied by five. Women not married and not in a registered partnership are used as a divisor for age–specific marriage rates.
2. Includes post-secondary non-tertiary education.
Marriage rate unchanged only in Päijät-Häme
Apart from Päijät-Häme, the marriage rate was lower in all regions in 2018 than in 2017. In relative terms, most marriages were contracted in Ostrobothnia and least in South Savo in 2018. The marriage rate shrunk most in relative terms in Pirkanmaa, by 13 per cent.
Marriage rate¹ by region² and whole country, opposite-sex couples
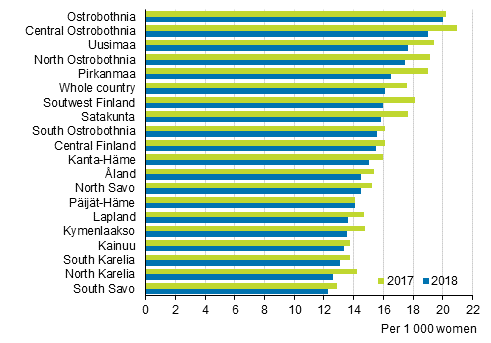
1. Married women per 1,000 non-married women and women not in a registered partnership of respective mean population.
2. Regional division 1.1.2019.
International marriages decreased slightly
The decrease in the marriage rate in the entire country was also visible as a decrease in international marriages. Seven per cent of women of Finnish background living permanently in Finland married men of foreign background in 2018. One year earlier the share was slightly higher, 7.5 per cent. Generally, the share of international marriages of all marriages entered into by women of Finnish background has, however, increased gradually. In 1990 to 2000, the above-mentioned share was around four to five per cent.
The development of the share of marriages between men of Finnish background and women of foreign background of all marriages is similar to that of women of Finnish background and men of foreign background. The share of marriages between men of Finnish background living permanently in Finland and women of foreign background among all marriages entered into decreased from 7.1 to 5.9 per cent in 2018.
There are more data on marriages and divorces between Finnish and foreign citizens on the Immigrants and integration thematic pages .
Nearly four in ten first marriages still end in divorce
In 2018, the probability that a woman’s first marriage ends in divorce was 37 per cent, which is one percentage point lower than in 2017. The figure for 2018 was on level with that of the 2005 to 2017, when it varied between 38 and 40 per cent. An interesting fact is that a first marriage ending in widowhood is slightly more probable than the marriage ending in divorce. The above-mentioned probabilities are based on the events of one year of opposite-sex married couples based on which the probability that an event takes place is calculated. In that case, e.g. the divorce rate can be summarised in one figure. Similar results can be reached by examining marriages of opposite-sex couples entered into in a particular year that end in divorce by the duration of the marriage, but in this case, there are as many divorce rates as years in which marriages are entered into.
The overall picture, is that since the 1990s, the divorce rates by the duration of the marriage are very similar and are thus not dependent on the year in which the marriage was entered into. For example, of the marriages entered into in 1990 to 2008, one-fifth had ended in divorce by the ninth year.
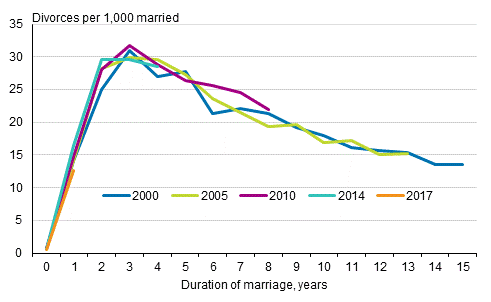
However, in recent years there has been some indication that the divorce rate during the early years of marriage might be decreasing slightly. For example, 4.7 per cent of the marriages entered into in 2014 ended in divorce in the third year of marriage, while the share for marriages entered into in 2016 was four per cent. Correspondingly, 1.7 per cent of marriages entered into in 2014 ended in divorce in the second year of marriage and 1.3 per cent of marriages entered into in 2017. This 0.4 percentage point change seems small but with low absolute numbers it is high in relative terms, 24 per cent.
Divorce rates cumulated for women entering into marriage in certain years by the end of 2018, opposite-sex couples
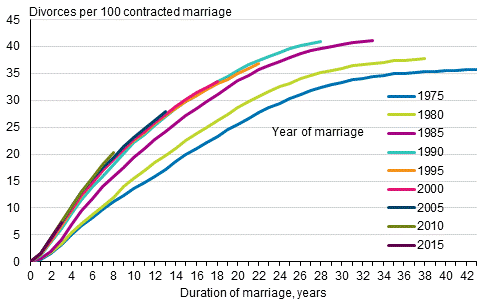
For a long time, the share of divorces was highest among those who had entered into marriages in 1985 until by 2017 a slightly higher share of marriages entered into in 1989 had ended in divorce. The order has not changed in 2018. By the end of 2018, in total 41.7 per cent of marriages entered into in 1989 had ended in divorce. By contrast, the share of divorces in marriages entered into in 1988 is as high as that of marriages entered into in 1985, 41.2 per cent. Persons who have entered into marriages during the years close to the years mentioned above also end up with a divorce percentage share of 40 per cent: 1982 to 1984, 1986 to1987 and 1990 to 1993. If the divorce rate remains at the level where it has been for a long time, it is highly possible that the other marriage cohorts of the 1980s and the 1990s will reach the same divorce rate level as those who entered into marriage in 1985 and 1989.
The risk of divorce grows steeply during the first years of marriage, as the following figure shows. The risk has been at its highest in the third or fourth year when the divorce rate in difference years of marriage has been examined starting from 1990. After the peak for divorcing is reached, the risk of divorce decreases very similarly in all marriage cohorts. The figure shows the above-mentioned recent development, based on which the risk of divorce has slightly contracted in the early years of marriage when comparing 2014 and 2017. Coming years will show, whether this contraction is merely random variation.
Divorces by year entering into marriage and duration of marriage, women, opposite-sex couples
Number of contracted same-sex marriages decreased by 34 per cent
As a result of the amendment to the Marriage Act, starting from 1 March 2017, same-sex partners enter into marriage and partnerships are no longer registered. From 1 March 2017 until the end of the year 554 same-sex couples entered into marriage. When the 36 couples who, before the legislation amendment had registered their partnership, are added, a total of 590 same-sex marriages and partnerships started in 2017. In 2018, same-sex couples could only enter into marriages and the number of such marriages decreased by nearly two hundred from the year before to 387. This is close the level of registered partnerships entered into in 2013, that is 373.
Since 2006, women have registered more partnerships than men per year. This has not changed when same-sex couples started entering into marriages instead of registered partnerships in 2017. In several years, the number of new official female couples has been double compared to male couples.
Registered partnerships 2002–2016 and registered partnerships and contracted same-sex marriages 2017¹–2018
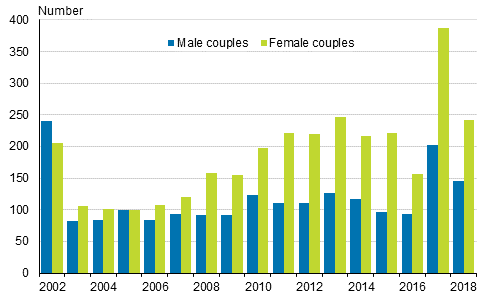
1. Year 2017 includes both registered partnerships and contracted marriages. Year 2018 contracted marriages.
Average age of male couples highest when entering into their first marriage
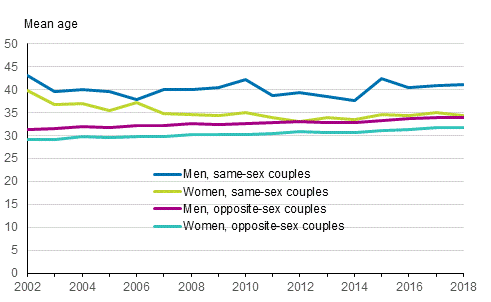
When examining same-sex couples entering into their first registered partnership or marriage, the average age of male couples has always been clearly higher than that of female couples, except in 2006 when they were almost equal. In 2018, the average age of male couples who entered into their first marriage was 41 years and that of female couples 34 years.
Mean age of men and women at first first registered partnership or at first marriage in 2002 to 018
Divorce rate among same-sex couples decreasing
In recent years, the divorce rate among same-sex couples has been decreasing, even though in the longer term, the trend of the divorce rate is still slightly growing. The divorce rate for opposite-sex couples has remained almost unchanged.
In 2018, the changes in the divorce rate were small both for same-sex and opposite-sex couples. The divorce rate for same-sex couples was 20 per one thousand couples, in the year before it was 21. The corresponding divorce rate for opposite-sex couples remained unchanged at 13 per one thousand couples.
There has been a clear difference in the divorce rates of male and female couples as female couples’ divorces have been clearly more common than that of male couples since 2004. As the divorce rate of female couples also decreased next to that of male couples in 2018, the divorce rate of all same-sex couples continued decreasing but slightly more strongly than in 2017.
Divorce rates from registered partnerships¹ and marriages 2003–2018
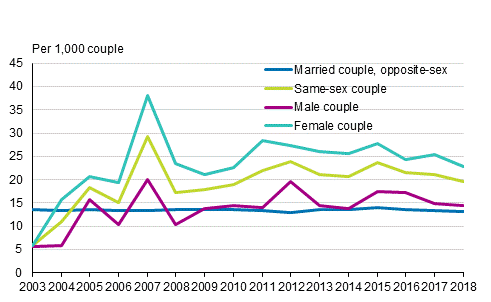
1. Divorces from registered partnerships 2003–2017. Year 2017 also includes divorces from same-sex marriages.
Source: Changes in marital status 2018. Statistics Finland
Inquiries: Timo Nikander 029 551 3250, info@stat.fi
Director in charge: Jari Tarkoma
Publication in pdf-format (377.7 kB)
- Tables
-
Tables in databases
Pick the data you need into tables, view the data as graphs, or download the data for your use.
Appendix tables
- Appendix table 1. First marriage rate by age and total period first marriage rate¹ 2007 to 2018, opposite-sex couples (14.11.2019)
- Appendix table 2. Marriage rate² by region¹ in 2007 to 2018, opposite-sex couples (14.11.2019)
- Appendix table 3. Divorces by age of mother and children aged under 18 in 2018, opposite-sex couples (14.11.2019)
- Figures
- Quality descriptions
-
- Quality description, changes in marital status (14.11.2019)
Updated 14.11.2019
Official Statistics of Finland (OSF):
Changes in marital status [e-publication].
ISSN=1797-643X. 02 2018. Helsinki: Statistics Finland [referred: 20.4.2025].
Access method: http://stat.fi/til/ssaaty/2018/02/ssaaty_2018_02_2019-11-14_tie_001_en.html

