Published: 18 November 2014
Most significant direct investors to Finland were Sweden and the United States in 2013
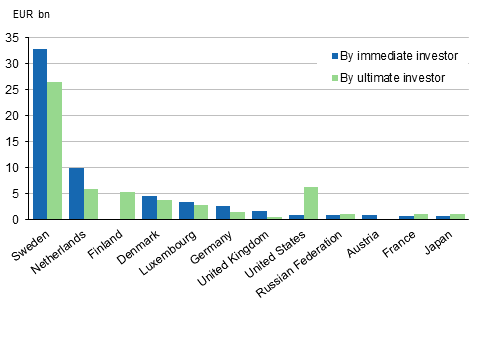
The new statistical standards and data collected on a more detailed level than before enable country-specific analyses of foreign direct investments (FDI) to Finland by the ultimate investing country, as well as by the conventional immediate investing country. The significance of the United States as to direct investments to Finland grows particularly in the new examination.
FDI to Finland by the investor country in 2013, investment stock

The share of Sweden and the Netherlands in direct investments to Finland gains emphasis when the figures are examined by the immediate investing country. When the figures are compared with those according to the ultimate direct investor, these countries turn out to be transit countries of capital, that is, more capital is immediately invested from them to Finland than what is actually managed there. Correspondingly, a larger share of direct investments to Finland is managed in the United States than actually immediately invested. Examined by the ultimate direct investor, the share of Finland is also significant. This is caused by domestic enterprises recycling capital through their foreign affiliates back to Finland.
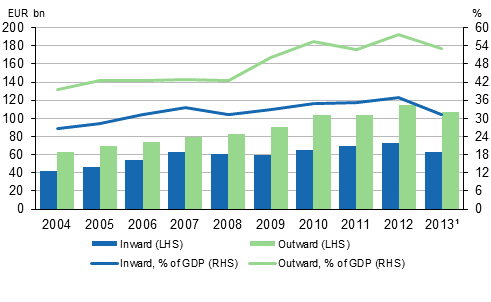
Outward exceeds inward FDI
At the end of 2013, the value of direct investments to Finland totalled EUR 63.2 billion. Returns from these investments amounted to EUR 2.7 billion, which corresponds to a rate of return of 4.3 per cent relative to the value of investments at the end of 2013. Examined by the immediate country, direct investments are made to Finland particularly from Sweden (52% of the investment stock), the Netherlands (16%) and Denmark (7%). Investments to Finland especially concern financing and insurance activities and the industry of other services.
At the end of 2013, the value of direct investments from Finland was EUR 106.9 billion. Returns from these investments totalled EUR 6.2 billion, which corresponds to a rate of return of 5.8 per cent. Direct investments have been made from Finland especially to Sweden (31% of the investment stock) and to the Benelux countries (27%). Investors are particularly metal industry and service enterprises.
Stocks of FDI in 2004 to 2013

1) The figures for 2013 are not comparable with those for the years 2004 to 2012 due to changes in the international statistical standard. The changes and their impacts are discussed in more detail in Section 2 of the review included in this publication.
This is the first publication of the statistics on foreign direct investments and now data concerning the statistical reference year 2013 are released. In future, Statistics Finland will release data on foreign direct investments every year.
Source: Foreign direct investments 2013, Statistics Finland
Inquiries: Kristian Taskinen 029 551 2238, Laura Wallenius 029 551 2997, balanceofpayments@stat.fi
Director in charge: Leena Storgårds
Publication in pdf-format (377.7 kB)
- Reviews
-
- 1. Foreign direct investments in 2013 (18.11.2014)
- 2. Reform of statistics on foreign direct investments (18.11.2014)
- Tables
-
Tables in databases
Pick the data you need into tables, view the data as graphs, or download the data for your use.
Appendix tables
- Quality descriptions
-
- Quality description: Foreign direct investments (18.11.2014)
Updated 18.11.2014
Official Statistics of Finland (OSF):
Foreign direct investments [e-publication].
ISSN=2342-351X. 2013. Helsinki: Statistics Finland [referred: 19.4.2025].
Access method: http://stat.fi/til/ssij/2013/ssij_2013_2014-11-18_tie_001_en.html

