Published: 15 April 2011
Birth rate continues to rise
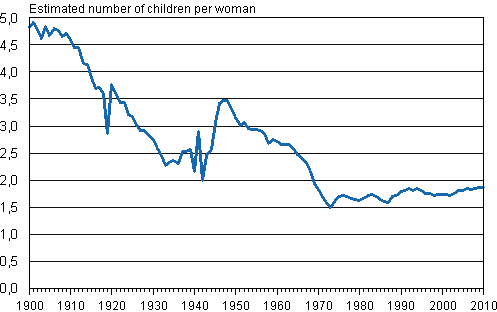
According to Statistics Finland's data on population changes, the slight rising of the birth rate continues. At the fertility rate prevailing in 2010, a woman would give birth to an average of 1.87 children during her reproductive age. The birth rate has now been going up for eight successive years. However, it is still below the threshold on population's renewal, which is approximately 2.1 children per woman.
Total fertility rate in 1900–2010

The number of births just failed to reach 61,000 and was 60,980 children. In 2010, 550 more children were born than in the year before.
The relative share of mothers born abroad among all mothers of born children has been growing steadily. Nine per cent of the mothers of the children born in 2010 had been born abroad, while the respective share in 1990 was only two per cent.
On the average, the women who gave birth in 2010 were of the same age as in the previous year. The mean age of all women at confinement remained almost unchanged at 30.1 years. By contrast, the mean age at first confinement rose by one decimal to 28.3 years. During the 2000s, the mean age at first confinement has risen by 0.7 years.
Measured with the total fertility rate, the birth rate was above the rate for the whole country in 11 regions in 2010. The Ostrobothnian regions had the highest relative numbers of births: 2.40 in North Ostrobothnia, 2.37 in Central Ostrobothnia, 2.18 in South Ostrobothnia and 2.15 in Ostrobothnia. The birth rate was above the threshold on population's renewal in only these four regions. The region of Uusimaa had the lowest average birth rate of 1.70.
Number of live births, total fertility rate and mother's mean age by live births in 2001–2010
| Year | 2001 | 2002 | 2003 | 2004 | 2005 | 2006 | 2007 | 2008 | 2009 | 2010 |
| Number of live births | 56 189 | 55 555 | 56 630 | 57 758 | 57 745 | 58 840 | 58 729 | 59 530 | 60 430 | 60 980 |
| Total fertility rate | 1,73 | 1,72 | 1,76 | 1,80 | 1,80 | 1,84 | 1,83 | 1,85 | 1,86 | 1,87 |
| Mother's mean age by all live births | 29,9 | 29,9 | 30,0 | 30,0 | 30,0 | 30,0 | 30,0 | 30,1 | 30,1 | 30,1 |
| Mother's mean age by first live birth | 27,6 | 27,7 | 27,9 | 27,8 | 27,9 | 28,0 | 28,1 | 28,2 | 28,2 | 28,3 |
Source: Population and Cause of Death Statistics. Statistics Finland
Inquiries: Timo Nikander (09) 1734 3250, vaesto.tilasto@stat.fi
Director in charge: Jari Tarkoma
Publication in pdf-format (334.3 kB)
- Tables
-
Tables in databases
Pick the data you need into tables, view the data as graphs, or download the data for your use.
Appendix tables
- Figures
- Quality descriptions
-
- Quality description, births 2010 (15.4.2011)
Updated 15.4.2011
Official Statistics of Finland (OSF):
Births [e-publication].
ISSN=1798-2413. 2010. Helsinki: Statistics Finland [referred: 3.4.2025].
Access method: http://stat.fi/til/synt/2010/synt_2010_2011-04-15_tie_001_en.html

