Published: 4 December 2020
Birth rate higher in rural areas, more births in urban areas
According to Statistics Finland’s data on population changes, over the past ten years, the birth rate has been falling steadily both in rural and urban areas. The birth rate is clearly higher in rural areas, but its significance to the birth rate of the whole country has diminished as a result of urbanisation. Altogether 78 per cent of all persons born in 2019 were born in urban areas.
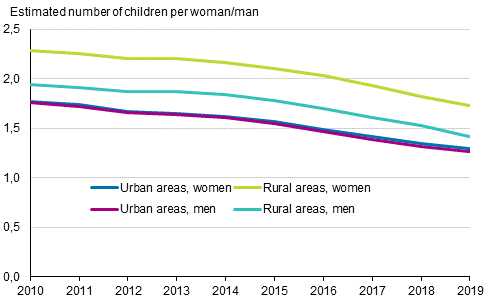
Women’s and men’s total fertility rate in urban and rural areas 2010–2019

The urban-rural classification makes it possible to examine the birth rate regionally regardless of administrative boundaries. In the examination seven area categories are combined with rural areas (local centres in rural areas, rural areas close to urban areas, rural heartland areas, sparsely populated rural areas) and urban areas (inner urban area, outer urban area, peri-urban area).
The birth rate is commonly measured with the total fertility rate, which indicates how many children a woman would give birth to during her life time if the birth rate remained the same as in the year on which the calculation is based.
In the 2010s, the birth rate has fallen more or less as strongly in rural and urban areas. The birth rate in rural areas has been clearly higher than in urban areas measured by the total fertility rate of both women and men. The significance of the higher fertility rate in rural areas to the birth rate of the whole country has, however, diminished, because the share of the population of family age living in rural areas of the whole country's population of family age has been falling steadily over the past decades. The share of the population aged 15 to 49 in rural areas of the population of the same age in the whole country was 30 per cent in 2000, while that share had fallen to 22 per cent in 2019.
The difference between sexes in total fertility rate is bigger in rural areas than in urban areas. In 2010, the total fertility rate of women living in rural areas was 2.29, while that of men was 1.95. In 2019, women's total fertility rate had fallen to 1.73 and men's to 1.42. Of the family-age population (15 to 49) in rural areas, 53 per cent were men. In absolute numbers, there were 28,800 more men aged 15 to 49 in rural areas than women of the same age.
In urban areas, the total fertility rate of both women and men is relatively low. Women's total fertility rate has fallen by 2019 to 1.29 and men's to as low as 1.25. Slightly more of the population aged 15 to 49 living in urban areas were men, 50.7 per cent.
The low birth rate in urban areas is more strongly visible in the birth rate of the whole of Finland due to the concentration of the population to urban areas. In 2019, altogether 78 per cent of Finland's population aged 15 to 49 lived in urban areas. In addition, according to the more detailed regional division, 44 per cent of the population aged 15 to 49 lived in inner urban areas in 2019, where women's total fertility rate was lowest of all areas of the urban-rural classification, 1.1 children per woman. It should be noted concerning the development of the birth rate that Finland's level of urbanisation has grown steadily over the past decades ( Population structure ).
Birth rate varies by the mother's and father's common educational level
In the following, the birth rate is viewed according to the mutual educational level of the father and the mother. The births where no register data are available on their father (1,246 persons) have been excluded from the examination. The birth rate is measured here by the general fertility rate. The figure proportions births to the number of women of childbearing age (15 to 49) but does not take into account the age structure of women. It should be noted that for computational reasons the number of births here is only proportioned to married or cohabiting women (or couples) aged 15 to 49. The definition raises the fertility rates of groups somewhat, but the figures are still useful when comparing the birth rate of educational groups.
General fertility rate among married and cohabiting couples of different sexes by spouses' level of education in 2019 (couples with a woman aged 15 to 49)
| Woman's level of education | Man's level of education | ||
| Basic education or unknown | Upper secondary education¹ | Tertiary education | |
| Basic education or unknown | 152 | 128 | 96 |
| Upper secondary education 1) | 109 | 107 | 88 |
| Tertiary education | 84 | 81 | 85 |
When the educational level of women and men is viewed together, the birth rate is higher for those with lower education in 2019. In couples where the educational level of both the woman and the man was basic or unknown, the fertility rate was high, 152 children per one thousand married/cohabiting couples with corresponding education. Also in couples where the woman's level of education was basic or unknown and the man had upper secondary level education, the general fertility rate was fairly high, 128 children per one thousand couples with corresponding education. Among women with upper secondary level education, the fertility rate was 107 children if the man had upper secondary level education and 109 children if the man's level of education was basic or unknown.
Birth rate higher when the spouses have the same level of education — also the man having higher education than his spouse is a benefit
Examined by educational group, having children was more common in 2019 for those married or cohabiting couples in which the spouses' levels of education are the same or close to each other. The number of such couples with a similar level of education was also higher than that of couples with a heterogeneous level of education.
When the general fertility rate is examined for couples where the educational level of the spouses differs from one another, the birth rate is found to be higher if the man's educational level is higher than that of the woman. When the man has tertiary level education and the woman has upper secondary level education, the general fertility rate is 88 children per one thousand corresponding couples. By contrast, the general fertility rate is 81 children if the woman has tertiary level education and the man has upper secondary level education. The same also occurs in other educational groups, such as for couples where one spouse has a tertiary level qualification and the other has basic or unknown level of education. Then the general fertility rate is 96 children per one thousand couples when the man has higher education than his spouse, but only 84 children when the woman has higher education.
With regard to the development of the birth rate, it should be noted that women's average level of education is higher in Finland than men's. Thirty-six per cent of all women aged 15 or over had attained tertiary level qualifications in 2019 (28 per cent of men). Twenty-five per cent of women and 28 per cent of men had basic level qualifications. In younger age groups (e.g. those aged 30 to 34) the differences were even bigger. ( Educational structure of the population. ) The gender gap in levels of education has been growing at least during 2017 to 2019 ( StatFin, Educational structure of the population )..
Fall in the birth rate slowed down slightly in all educational groups in 2019
When examining annual changes in the birth rate by level of education, it can be seen that in 2019 the drop in the birth rate was slightly smaller in all educational groups than in the previous year. For those with tertiary level education the annual change was 0.6 percentage points lower than in the year before, for those with upper secondary level education 2.8 percentage points and for those with basic level education 0.5 percentage points lower.
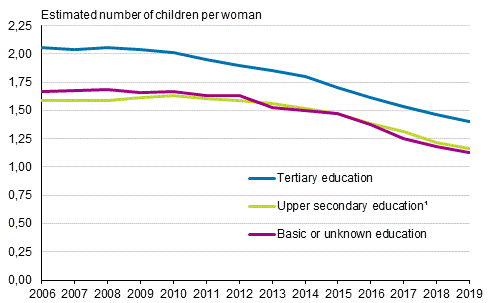
Total fertility rate of women born in Finland by level of education in 2006 to 2019

1. Includes post-secondary non-tertiary education.
The data concern here only mothers born in Finland. Some qualifications taken abroad are missing from Statistics Finland's Register of Completed Education and Degrees, for which reason the qualification data of many persons born abroad are deficient.
The decrease in the total fertility rate in the whole country that started after 2010 also continued in all women's educational groups in 2019. The fertility rate of women with basic level education has gone down by 33 per cent and that of women with tertiary level education by 30 per cent from 2010. The fertility rate has diminished slightly less among those with upper secondary level education, by 29 per cent.
The fall in the total fertility rate has been similar for men to that for women. However, the change from 2010 has been steeper in all men’s educational groups. It has been particularly big for men with basic level education, 40 per cent in nine years. Only in this educational group the change in 2019 was bigger than in 2018, though just a little (appendix figure 1).
Fall in the birth rate of first children slowing down is a sign of change
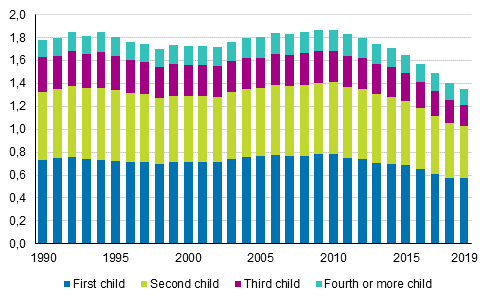
The total fertility rate can be broken down by the order number of the child born. The figure below shows that the birth rate for the first child fell only a little compared with the previous year. For example, in 2019, the fertility rate for the first child decreased by 0.8 per cent from the previous year, while in 2016 to 2018 the annual fall rate was five to six per cent.
For the second child, the birth rate continued to decrease at the same rate as in the previous year. For the third child, the birth rate decreased slightly less than in the year before, while for the fourth or more children the fall was nearly 10 per cent, which is clearly the biggest annual change in the fall in the birth rate that started after 2010. The share of children born in the fourth or higher order number is, however, smallest, 10 per cent of the birth rate.
The share of the first child in total fertility is highest, for example, since 1990 it has varied between 41 and 43 per cent. If the birth rate for the first child had fallen by five per cent in accordance with the previous year, total fertility would have fallen to 1.32 instead of 1.35 in 2019.
Total fertility rate broken down by birth order of child 1990–2019

The birth rate has declined considerably from 2010 by 2019. Measured by the total fertility rate, it has decreased in nine years by almost 28 per cent, from 1.87 to 1.35 children per woman. In terms of the number of births, this means a drop from 61,000 births in 2010 to 45,600 births in 2019. However, the decrease in the birth rate in recent years at the fairly steady annual rate of five per cent seems to have diminished, as the fall amounted to 4.2 per cent in 2019.
Finland's birth rate lowest in Nordic countries
Since 2014, Finland has had the lowest birth rate in the Nordic countries. In Finland, the birth rate has fallen in relative terms more steeply than in all the other Nordic countries since 2010. The birth rate continued to fall in all Nordic countries in 2019, except for Iceland, where the fall in the birth rate ended in 2018. In 2019, the birth rate rose slightly in Iceland from the previous year and was 1.75 children per woman.
Share of persons with Finnish background in the birth rate ever smaller
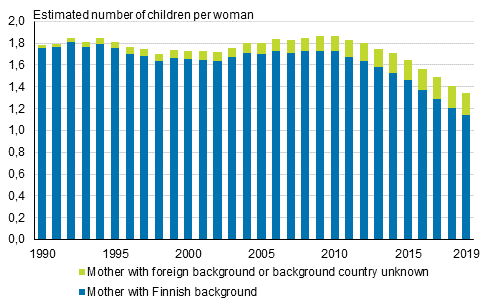
The share of women with Finnish background in the birth rate decreased by one percentage point to 85 per cent in 2019 when measured with the total fertility rate. In 2019, the total fertility rate for the whole country was 1.35 children per woman, of which the share of those with Finnish background was 1.15 children per woman. In 2010, the total fertility rate for the whole country was 1.87 children per woman, of which 1.72 were of Finnish background. It corresponded to 92 per cent of the birth rate in the whole country.
Total fertility rate broken down by mother's origin in 1990 to 2019

The share of persons with foreign background in the birth rate of the whole country has increased slowly from the 1990s and is currently 15 per cent of the whole country’s birth rate. In the corresponding time, the share of women with foreign background in all women aged 15 to 49 has grown slightly more slowly, however, and was slightly under 11 per cent at the end of 2019. However, the growth in the number of women with foreign background has been big, from close on 10,000 in 1990 to around twelve-fold, or 121,000 in 2019.
Further information about the birth rate according to origin is available on Statistics Finland's Immigrants and integration thematic pages in the section birth rate .
Source: Births 2019. Statistics Finland
Inquiries: Juhana Nordberg 029 551 3051, Timo Nikander 029 551 3250, info@stat.fi
Head of Department in charge: Hannele Orjala
Publication in pdf-format (298.9 kB)
- Tables
-
Tables in databases
Pick the data you need into tables, view the data as graphs, or download the data for your use.
Appendix tables
- Figures
- Quality descriptions
-
- Quality description, births 2019 (4.12.2020)
Updated 04.12.2020
Official Statistics of Finland (OSF):
Births [e-publication].
ISSN=1798-2413. 02 2019. Helsinki: Statistics Finland [referred: 20.4.2025].
Access method: http://stat.fi/til/synt/2019/02/synt_2019_02_2020-12-04_tie_001_en.html

