Published: 27 October 2010
Energy use in manufacturing diminished by 13 per cent in 2009
According to Statistics Finland data, energy use in manufacturing totalled 508 petajoule (PJ) in 2009. Compared with the previous year, energy use in manufacturing diminished by 13 per cent. The economic downturn reduced the consumption of electricity in manufacturing. In 2009 the volume of industrial output contracted by over 20 per cent, which also contributed to the reduction in the consumption of energy.
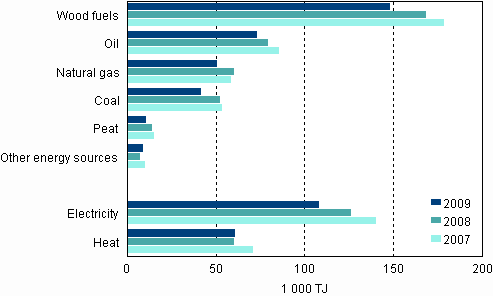
Use of energy sources in manufacturing

As in the previous year, the most used fuels in manufacturing were wood, oil and natural gas. The use volume of nearly each energy source diminished. The total use of electricity in manufacturing dropped by over 20 per cent from 2008. The use of net electricity also declined compared with the previous year, while the use of net heat remained almost on level with the previous year.
The regions of North Ostrobothnia, Itä-Uusimaa and South Karelia each used some 12 per cent of the energy used in all manufacturing. The least energy was used by manufacturing enterprises in the regions of Etelä-Savo, Kainuu and Åland, under one per cent of all energy used in manufacturing. Of the industries, the most energy was used in the forest and chemical industries. Energy use increased slightly from the previous year only in machinery and metal manufacturing and in the food industry.
In 2009, the forest industry accounted for around 51 per cent of the total use of electricity in manufacturing. The least electricity was used in the manu-facture of textiles and wearing apparel. Of the regions, the manufacturing establishments of Central Finland and Satakunta used the most electricity. Each of these two regions accounted for over 10 per cent of the total electricity used in manufacturing.
Total consumption of electricity in manufacturing
| Industries | GWh | Change % | 95% confidence interval, ± % |
| Forest industry | 19 053,5 | -32,7 | 1,49 |
| Chemical industry | 6 263,6 | -7,7 | 4,6 |
| Manufacture of basic metals | 4 547,5 | -20,3 | 4,2 |
| Machinery and metal manufacturing | 2 179,8 | -18,4 | 12,5 |
| Food industry | 2 109,7 | 26,3 | 16,6 |
| Other manufacturing | 1 579,8 | -10,8 | 22,4 |
| Manufacture of electrical and optical equipment | 830 | 1,4 | 24,6 |
| Mining and quarrying | 477,1 | -11,8 | 27,6 |
| Manufacture of textiles and wearing apparel | 231,8 | -16,2 | 24,8 |
| Total | 37 272,9 | -20,9 | 2,0 |
These statistics are based on an inquiry about energy use in manufacturing. The data were collected with the annual inquiry from establishments in the industry categories of Mining and quarrying (B) and Manufacturing (C) of the standard industrial classification TOL2008, as well as from the power plants closely connected with the activities of these establishments. The inquiry does not extend to category D, Electricity, gas and steam supply, of the classification. The data for 2008 were collected from a sample consisting of some 2,200 establishments. The data are published by energy source, industry and region.
Source: Energy use in manufacturing, Statistics Finland
Inquiries: Kirsi-Marja Aalto (09) 1734 3442, energia@tilastokeskus.fi
Director in charge: Leena Storgårds
Publication in pdf-format (291.9 kB)
- Tables
-
Appendix tables
- Figures
-
- Appendix figure 1. Use of energy sources in manufacturing (27.10.2010)
- Appendix figure 2. Energy use in manufacturing by energy source 2009 (27.10.2010)
- Appendix figure 3. Energy use in manufacturing by industry (27.10.2010)
- Appendix figure 4. Energy use in manufacturing by region (27.10.2010)
- Appendix figure 5. Total electricity consumption in manufacturing 2009 (27.10.2010)
- Appendix figure 6. Total electricity consumption by manufacturing branch 2008 and 2009 (27.10.2010)
- Appendix figure 7. Total electricity consumption in manufacturing by region (27.10.2010)
Updated 27.10.2010
Official Statistics of Finland (OSF):
Energy use in manufacturing [e-publication].
ISSN=1798-7776. 2009. Helsinki: Statistics Finland [referred: 19.4.2025].
Access method: http://stat.fi/til/tene/2009/tene_2009_2010-10-27_tie_001_en.html

