Published: 16 January 2013
Carbon dioxide emissions from private motoring larger than those from professional land transport
Carbon dioxide emissions from private motoring amounted to good five million tonnes in 2010. The amount of emissions was larger than in professional land transport, which carbon dioxide emissions were slightly over four million tonnes. In addition, professional water transport generated carbon dioxide emissions to the tune of three million, similarly as did air transport.
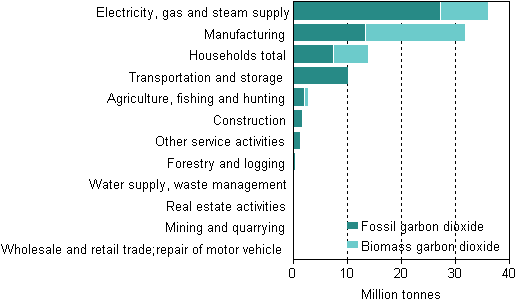
In all, carbon dioxide emissions of fossil fuels produced directly by households amounted to 7,6 million tonnes and biofuels to 6,5 million tonnes. In addition to motoring, households' carbon dioxide emissions are generated from heating. Emissions from households' purchased electricity and heating are calculated in the industry of energy production.
Carbon dioxide emissions into air by industry groups 2010

Carbon dioxide emissions from fossil fuels produced by Finnish residents in Finland or abroad totalled 66 million tonnes in 2010. The corresponding emissions from manufacturing were nearly 13,5 million tonnes and from energy production 27 million tonnes. Emissions from energy production are caused by the production of electricity, heating and cooling supplied to production and consumption. In addition, the use of biofuels produced 35 million tonnes of carbon dioxide emissions.
Emissions into air by industry groups 2010, tonnes
| Industry (TOL2008) | Fossil garbon dioxide (CO2) |
Biomass garbon dioxide (CO2–bio) |
Nitrous oxide (N2O) |
Methane (CH4) | Sulphur dioxide (SO2) |
Nitrogen dioxide (NO2) |
Carbon monoxide (CO) |
| Agriculture, fishing and aquaculture, hunting | 2 298 410 | 672 191 | 12 910 | 91 213 | 1 370 | 14 240 | 17 858 |
| Manufacturing | 13 547 952 | 18 431 278 | 1 131 | 1 020 | 26 559 | 33 247 | 30 493 |
| Electricity, gas, steam and air conditioning | 27 327 537 | 8 889 751 | 1 075 | 1 104 | 31 255 | 44 239 | 19 271 |
| Trade, transportation and other service activities | 12 346 949 | 142 694 | 495 | 2 233 | 23 332 | 96 882 | 78 962 |
| Other industries | 3 004 138 | 47 692 | 613 | 96 875 | 389 | 17 492 | 25 343 |
| Households | 7 587 446 | 6 539 310 | 383 | 13 145 | 3 300 | 25 791 | 306 103 |
| Total | 66 112 434 | 34 722 917 | 16 606 | 205 590 | 86 205 | 231 892 | 478 030 |
Emissions into air by industry are new statistics at Statistics Finland and the results are now released for the first time. The statistics are part of the environmental accounts, where the main principle is to describe the interaction between the environment and the economy in such ways that assist decision-making and research. In the statistics on emissions into air by industry, emissions are presented according to the industrial classification used in national accounts. In this way, the data on emissions into air can be directly connected to various monetary variables of national accounts, such as total output and value added.
The statistics on emissions into air by industry include carbon dioxide emissions from biofuels. These emissions are not included in the greenhouse gas emission data submitted to the UNFCCC Secretariat by Finland. Differing from the greenhouse gas inventory and greenhouse gas reporting, the statistics on emissions into air by industry also contain Finnish citizens' emissions from land, water and air transport abroad. In turn, emissions by foreign citizens from land, water and air transport on Finnish territory are subtracted from the emissions into air by industry. The definition of transport also corresponds with the approach of national accounts in which households' transport is included in private consumption.
The industrial classification and division do not correspond with the sector division used in the reporting of the greenhouse gas emissions. The statistics on emissions into air by industry do not either take into consideration the amount of carbon dioxide absorbed by forest or other vegetation.
The European Union's regulation concerning environmental accounts obliges the Member States to compile statistics and report annually on emissions into air by industry; for the first time in September 2013 concerning data for the years 2008 to 2011.
Source: Emissions into air by industry 2010, Statistics Finland
Inquiries: Niina Autio 09 1734 3406, Jukka Muukkonen 09 1734 3224, ymparisto.energia@stat.fi
Director in charge: Leena Storgårds
Publication in pdf-format (296.9 kB)
- Tables
-
Tables in databases
Pick the data you need into tables, view the data as graphs, or download the data for your use.
Appendix tables
- Appendix table 1. Fossil carbon dioxide emissions (CO2) 2008-2010, tonnes 1) (16.1.2013)
- Appendix table 2. Biomass carbon dioxide emissions (CO2-bio) 2008-2010, tonnes (16.1.2013)
- Appendix table 3. Nitrous oxide emissions (N2O) 2008-2010, tonnes (16.1.2013)
- Appendix table 4. Methane emissions (CH4) 2008-2010, tonnes (16.1.2013)
- Appendix table 5. Sulphur dioxide emissions (SO2) 2008-2010, tonnes (16.1.2013)
- Appendix table 6. Nitrogen dioxide emissions (NO2) 2008-2010, tonnes (16.1.2013)
- Appendix table 7. Carbon monoxide emissions 2008-2010 (CO), tonnes (16.1.2013)
- Appendix table 8. Emissions into air 2010, tonnes (16.1.2013)
Updated 16.1.2013
Official Statistics of Finland (OSF):
Emissions into air by industry [e-publication].
ISSN=2323-7600. 2010. Helsinki: Statistics Finland [referred: 19.4.2025].
Access method: http://stat.fi/til/tilma/2010/tilma_2010_2013-01-16_tie_001_en.html

