This set of statistics has been discontinued.
Statistical data on this topic are published in connection with another set of statistics.
Data published after 5 April 2022 can be found on the renewed website.
Published: 17 December 2010
Contraction of income differentials continued in 2009
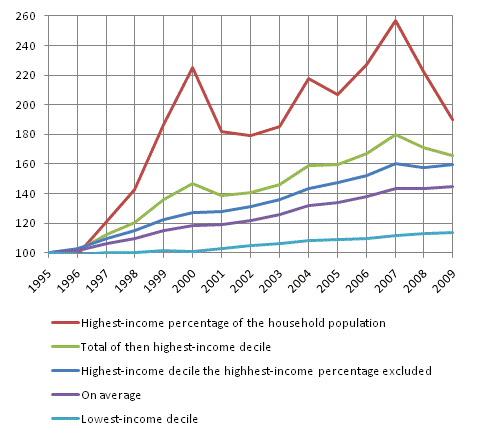
The contraction of income differentials, which started in 2008, continued through 2009. In the highest-income decile of the population, average income fell by 3 per cent but in the highest-earning percentage of the population income decreased by 15 per cent. By contrast, in other income deciles income went up in 2009. Statistics Finland's total statistics on income distribution show that in the lowest-income decile of the household-dwelling population the growth of income in real terms was only half-a-per cent whereas in the income deciles from two to nine it amounted to between 2 and 2.5 per cent.
Development of real income of the household-dwelling population 1995-2009 Concept of income: average dispos-able money income per consumption unit among the population

Income development was most favourable in the sub-regional unit of Sisä-Savo and least favourable in the sub-regional unit of Suupohja
Real income grew fastest in the sub-regional unit of Sisä-Savo where the median of the disposable income of household-dwelling units was 4.5 per cent higher in real terms in 2009 than one year earlier. The growth of household-dwelling units' income also exceeded four per cent in the sub-regional unit of Pielisen Karjala. In the sub-regional unit of Helsinki, the country’s biggest in terms of population, household-dwelling units' income went up by 2.8 per cent.
Household-dwelling units' income grew by least in the sub-regional unit of Suupohja in South Ostrobothnia where their median income decreased by one-tenth of a per cent in real terms from 2008. The growth of income was also modest in the sub-regional units of Kyrönmaa, Ylivieska, Järviseutu and Kaakkois-Pirkanmaa in 2009, as in them the growth in the median income of household-dwelling units in real terms remained under one per cent in 2009.
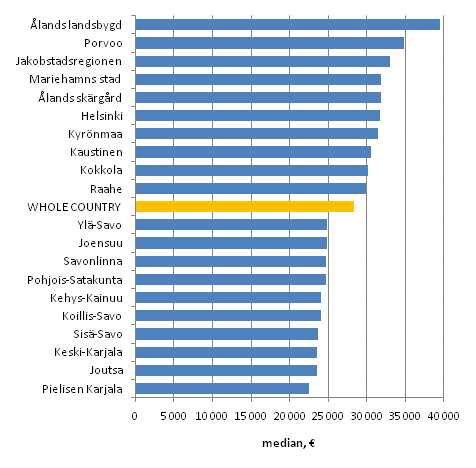
The household-dwelling units with the highest income are found in the sub-regional unit of Ålands landbygd in the Åland Islands where the median income of household-dwelling units amounted to EUR 39,570 in 2009. In real terms, this is 2.7 per cent more than one year earlier. The household-dwelling units with the lowest income are found in the sub-regional unit of Pielisen Karjala where the median income of household-dwelling units was EUR 22,500. The median income of household-dwelling units for the whole country was EUR 28,340, or 2.4 per cent higher than one year earlier.
Disposable monetary income (EUR) per household-dwelling unit in 2009, median. Ten highest-income and lowest-income sub-regional units

Source: Total statistics on income distribution, Statistics Finland
Inquiries: Pekka Ruotsalainen (09) 1734 2610
Director in charge: Riitta Harala
- Tables
-
Tables in databases
Pick the data you need into tables, view the data as graphs, or download the data for your use.
Updated 17.12.2010
Official Statistics of Finland (OSF):
Total statistics on income distribution [e-publication].
2009. Helsinki: Statistics Finland [referred: 20.4.2025].
Access method: http://stat.fi/til/tjkt/2009/tjkt_2009_2010-12-17_tie_001_en.html

