Published: 29 December 2011
Number of households with difficulties in making ends meet was 650,000 in 2010
Altogether approximately 650,000 households, or 25.4 per cent of all households, had difficulties in making ends meet in 2010. Their number increased by around 50,000 households, that is, by 1.8 percentage points from 2009. These data derive from the information collected in connection with Statistics Finland's income distribution statistics.
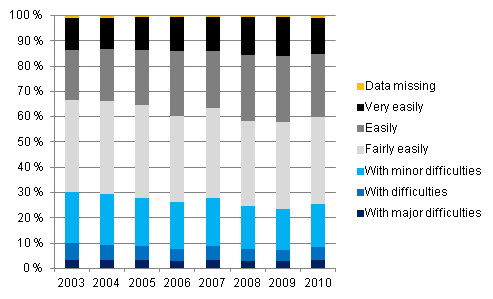
Ability to cover regular outlays with income in 2003–2010, % of households

Households finding it difficult to cope with their regular outlays with their income are defined as households with difficulties in making ends meet. The information is based on the data collected from 2003 onwards from households on whether they have managed to cover their regular outlays with their income with major difficulties, difficulties, minor difficulties, fairly easily, easily or very easily. In 2010 minor difficulties were experienced by 17.0 per cent, difficulties by 5.2 per cent and major difficulties by 3.2 per cent of households. In all, 25.4 per cent of all households had difficulties in making ends meet, and 8.3 per cent of households had greater difficulties (difficulties or major difficulties). Households saying that they found it very easy to cover their regular outlays with their income numbered 371,000, or 14.5 per cent of households in 2010. Compared with 2003, there were 10.8 per cent fewer households with difficulties in making ends meet and 21.0 per cent more households finding it very easy to make ends meet.
In 2010, the number of households with difficulties in making ends meet started to grow. The number grew by 50,000 households, up by 1.8 per cent from 2009 to 2010. This was mostly (around 50% of the growth) due to the growing number of pensioner households with difficulties in making ends meet. The number of pensioner households increased and the share of pensioner households with difficulties in making ends meet rose from 22.1 per cent in 2009 to around 24.5 per cent in 2010. According to the socio-economic group, the number of households with difficulties in making ends meet also grew among other self-employed persons (excl. agricultural entrepreneurs), workers and lower-level salaried employees, but less in relative terms. The number of unemployed households grew, which also partly increased somewhat the share of households with difficulties in making ends meet in the whole population.
Examined by population group, difficulties in making ends meet are experienced more often than average by unemployed persons, student households and other economically inactive households (excl. pensioners), single carer households and under 65-year-old one-person households. Difficulties in making ends meet are notably more widespread in the households of unemployed persons than in other population groups. Of unemployed households, 62.1 per cent had difficulties in covering their regular outlays with income in 2010. According to the socio-economic group, 48.0 per cent of student households and 52.9 per cent of other economically inactive households also had difficulties in making ends meet in 2010. According to the household's stage in life, 50.9 per cent of single carer households found it difficult to make ends meet in 2010.
The households with difficulties in making ends meet most often belong to the lowest-earning income groups. There were differences in income level and its development according to the severity of difficulties in making ends meet. Per consumption unit, equivalent disposable income, which takes into account differences in consumption needs arising from differences in households structures, was EUR 19,180 among households with difficulties in making ends meet, EUR 20,640 among households with minor difficulties in making ends meet, and EUR 16,190 among households with major difficulties in making ends meet. The average equivalent disposable income of all households was EUR 26,440 per consumption unit in 2010. From 2009 to 2010, the income level of households with difficulties in making ends meet grew slightly faster than average. Per consumption unit, the equivalent disposable income of households with difficulties in making ends meet grew in real terms by 2.9 per cent, for all households the real income growth was 2.5 per cent, on average. The income level of households with difficulties in making ends meet was still clearly lower than in the first half of the 2000s compared with the average income of households. From 2003 to 2010 the real income growth was for those with difficulties in making ends meet 10.3 per cent, while for all households income increased by 16.7 per cent, on average.
Source: Income Distribution Statistics, Statistics Finland
Inquiries: Marie Reijo (09) 1734 2547, toimeentulo.tilastokeskus@stat.fi
Director in charge: Riitta Harala
- Tables
-
Tables in databases
Pick the data you need into tables, view the data as graphs, or download the data for your use.
Updated 29.12.2011
Official Statistics of Finland (OSF):
Income distribution statistics [e-publication].
ISSN=1799-1331. Subjective financial well-being 2010. Helsinki: Statistics Finland [referred: 26.4.2025].
Access method: http://stat.fi/til/tjt/2010/01/tjt_2010_01_2011-12-29_tie_001_en.html

