Published: 23 May 2012
Development of income more favourable among owner-occupiers than among renters
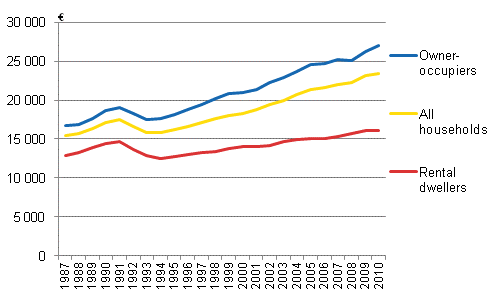
The income differential between owner-occupier households and rental dweller households has grown significantly over the past 15 years. According to Statistics Finland's income distribution statistics, from 1995 to 2010 income level went up by 49 per cent among owner-occupier households and by 26 per cent among rental dweller households. In 2010, the average disposable income per consumption unit was EUR 26,970 for owner-occupiers and EUR 16,150 for renters. Of the 2,551,000 households in Finland, 68 per cent live in owner-occupied dwellings and 30 per cent in rented dwellings. One-half of the owner-occupied dwellings are debt-free.
Disposable income per consumption unit by tenure status of dwelling in 1987-2010, at 2010 currency value.

Households' average housing costs (including housing loan interests but not amortisations) amounted to 12 per cent of their disposable cash income in 2010. For rental dwellers the share was 22 per cent, for owner-occupiers of indebted dwellings 10 per cent and for owner-occupiers of debt-free dwellings 9 per cent. When amortisations of housings loans are also taken into consideration, housing costs accounted for the same share of income among owner-occupiers of indebted dwellings as among rental dwellers, i.e. 23 per cent.
If there is no housing debt, owner-occupier households have more money left for other consumption than other households with corresponding cash income do. The low loan interest rates in recent years have brought down the housing costs of owner-occupier households. However, it has also meant smaller tax deduction benefits. On the other hand, the rising of rents has increased differences in consumption possibilities between owner-occupier and rental dweller households.
In income distribution statistics the benefit gained from owner-occupancy is taken into consideration when calculating households' disposable income. However, the change percentages are almost identical even if imputed income from owner-occupied dwellings is deducted from income.
According to the latest income distribution statistics the median disposable income of a household was EUR 33,410 in 2010. The growth from the year before amounted to 1.7 per cent in real terms. However, the growth was minor by the yardstick of the 2000s. In the 2000s, households' income developed less favourably only during the 2006-2008 period.
Wage and salary income did not grow at all in 2010. During the two previous years, wages and salaries grew significantly only among households of people in 35–44 age group. Significant growth was only recorded in property income and current transfers received. Entrepreneurial income, especially from forestry, grew by 3.4 per cent. Hence, the income of self-employed persons and persons self-employed in agriculture, which mainly consists of entrepreneurial income and property income, grew by most in relative terms.
Source: Income Distribution Statistics 2010, Statistics Finland
Inquiries: Hannele Sauli 09 1734 3497, Kaisa-Mari Okkonen 09 1734 3408, toimeentulo.tilastokeskus@stat.fi
Director in charge: Riitta Harala
Publication in pdf-format (270.7 kB)
- Tables
-
Tables in databases
Pick the data you need into tables, view the data as graphs, or download the data for your use.
Appendix tables
- Appendix table 1. Income shares of decile groups (%) in 1966 - 2010. (23.5.2012)
- Appendix table 2. Gini-coefficients for factor income, gross income and disposable income, and redistributive effect of current transfers on income differentials in 1966 - 2010. (23.5.2012)
- Appendix table 3. Household income: structure by brackets ordered according to households' gross income 2010. (23.5.2012)
Updated 23.5.2012
Official Statistics of Finland (OSF):
Income distribution statistics [e-publication].
ISSN=1799-1331. 2010. Helsinki: Statistics Finland [referred: 19.4.2025].
Access method: http://stat.fi/til/tjt/2010/tjt_2010_2012-05-23_tie_001_en.html

