Published: 20 March 2015
Risk of poverty especially burdens young adults
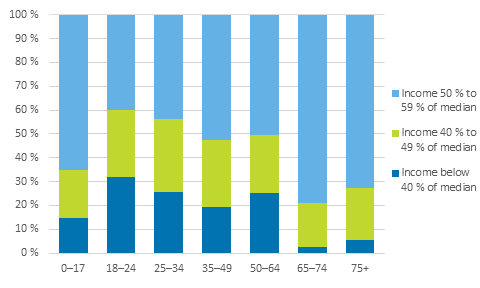
Statistics Finland’s income distribution statistics indicate that the risk of poverty is more common and deeper among young adults than other age groups. People aged 18 to 24 are more often than other age groups at the very low end of income distribution and their income is farther than that of others from the at-risk-of-poverty threshold. The majority of old-age pensioners with low income are quite close to the at-risk-of-poverty threshold and their income is higher than that among persons at-risk-of-poverty in other age groups.
Structure of risk-of-poverty in age groups in 2013

Those whose income is below 40 per cent of the median income are most at-risk-of-poverty. Large groups among these are students aged 18 to 24 and those having been unemployed for at least six months during reference year, who are present in all working age groups. Young students make up one-fifth of persons most at-risk-of-poverty and unemployed persons 23 per cent. One-fifth of those at-risk-of-poverty are employed persons, mainly self-employed. Forty-five per cent of those most at-risk-of-poverty are aged 18 to 34 (Table). Risk of poverty experienced by young people can be described as deep, because the median income of young people at-risk-of-poverty is lower than that of other age groups and the distance of the median income from the at-risk-of-poverty threshold (so-called poverty gap) is big (see Review, Section 3).
Nearly all persons aged 65 or over below the at-risk-of-poverty threshold of 60 per cent are pensioners. Three out of four old-age pensioners at-risk-of-poverty were quite close to the at-risk-of-poverty threshold, that is, in the group whose income is 50 to 59 per cent of the national median income. Those aged 65 or over are the biggest age group close to the at-risk of-poverty threshold, as they constitute one-third of this group. In contrast, there are few pensioners in the groups most at-risk-of-poverty. The income of those at pensionable age at-risk-of-poverty is higher and the poverty gap is smaller than for other age groups.
Table. Number of persons at-risk-of-poverty in different sections of the at-risk-of-poverty distribution by the person's age in 2013
| Income below 40% of median | Income 40% to 49% of median | Income 50% to 49% of median | All persons at-risk-of-poverty | |
| All persons | 130 000 | 170 000 | 390 000 | 690 000 |
| Aged 0 to 17 | 18 000 | 23 000 | 77 000 | 118 000 |
| Aged 18 to 24 | 36 000 | 32 000 | 45 000 | 114 000 |
| Aged 25 to 34 | 23 000 | 27 000 | 40 000 | 90 000 |
| Aged 35 to 49 | 16 000 | 24 000 | 44 000 | 85 000 |
| Aged 50 to 64 | 29 000 | 29 000 | 59 000 | 117 000 |
| Aged 65 to 74 | .. | 11 000 | 46 000 | 58 000 |
| Aged 75 or over | .. | 24 000 | 79 000 | 108 000 |
Persons are classified as being at-risk-of-poverty when the household's disposable monetary income per consumption unit 1) is below 60 per cent of the national median income. In 2013, the at-risk-of-poverty threshold for a one-person household was EUR 14,260 per year or EUR 1,190 per month. Income refers to the monetary income after taxes and consists of earned income, property income, and transfer income.
In the group close to the risk-of-poverty threshold, the income is at least EUR 11,880 but under 14,260 per year (EUR 990 to 1,190 per month). Persons whose household's disposable monetary income is below EUR 9,510 per year, that is, under EUR 792 per month per consumption unit are classified in the group most at-risk-of-poverty. The middlemost group at-risk-of-poverty, whose income is 40 to 49 per cent of the national median income, is placed between these income groups. The income per consumption unit for those belonging to this group is at least EUR 9,510 but under 11,880 per year (EUR 792 to 990 per month).
1) The consumption units are based on the so-called OECD's modified scale. One adult in the household is one consumption unit. Other persons in the household aged at least 14 each are 0.5 consumption units and children aged 0 to 13 each are 0.3 consumption units. A household with one adult member is one consumption unit, while a household consisting of spouses and one child aged under 14 together are 1.8 consumption units.
Source: Income Distribution Statistics 2013, Statistics Finland
Inquiries: Kaisa-Mari Okkonen 029 551 3408
Director in charge: Riitta Harala
- Tables
-
Tables in databases
Pick the data you need into tables, view the data as graphs, or download the data for your use.
Updated 20.3.2015
Official Statistics of Finland (OSF):
Income distribution statistics [e-publication].
ISSN=1799-1331. Income inequality (international comparison) 2013. Helsinki: Statistics Finland [referred: 19.4.2025].
Access method: http://stat.fi/til/tjt/2013/01/tjt_2013_01_2015-03-20_tie_001_en.html

