Published: 2 April 2015
Pensioner households have large income differences
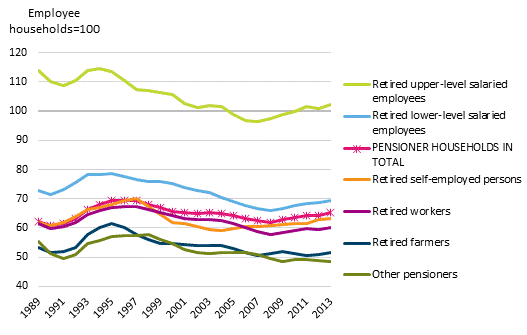
Statistics Finland's income distribution statistics indicate that the income of pensioner households is around 65 per cent of the income of employee households. Among pensioner households, households of former upper-level salaried employees have clearly the highest income and their income exceeds the income level of employee households. Pensioner households where a pensioner living on national pension or a former farmer is responsible for the primary livelihood are in the weakest position. In these groups the income of households is only around one-half of that of an average employee household.
Relation of the income of pensioner households to the income of employee households*

*) The income ratios in the figure were calculated from the median for households' equivalent disposable monetary income as three-year moving averages. Equivalent income is derived when the household's disposable income is divided by the number of consumption units in the household.
In the 1990s and early 2000s, the income of retired upper-level salaried employee households was still clearly higher than that of employee households, but the income level of employee households rose during the prolonged economic growth in the mid-2000s above the income level of retired upper-level salaried employee households for a few years. The income level of other pensioner households remains clearly below the income of employee households.
The income of pensioner households is not as sensitive to cyclical variations as that of working-age people. Both during the recession in the 1990s and the economic downturn in the last few years, the relative income position of pensioner households has improved compared with employee households. This is due to the stability of pension income, as no direct cuts have been directed to pensions even in economically difficult times. In contrast, wage and salary income and entrepreneurial income typical of working-age people is more sensitive to cyclical variations.
In 2013, there were nearly 870,000 pensioner households in Finland, which is around one-third of all households. Of pensioner households, most were households of former workers, being nearly 320,000. The number of lower-level salaried employees on pension was 260,000 and that of upper-level salaried employees 120,000. Households of former farmers numbered 70,000 and of other former self-employed persons good 60,000. There were nearly 35,000 other pensioner households living primarily on national pension in 2013.
The examinations above were made with the median for equivalent disposable monetary income. The income concept is internationally comparable and it does not include imputed income items (such as income from owner-occupied dwellings) or sales profits. Comparisons by households' population group with different income concepts can be made with the help of the database tables of the income distribution statistics.
Source: Income Distribution Statistics 2013, Statistics Finland
Inquiries: Pekka Ruotsalainen 029 551 2610
Director in charge: Riitta Harala
- Tables
-
Tables in databases
Pick the data you need into tables, view the data as graphs, or download the data for your use.
Updated 02.04.2015
Official Statistics of Finland (OSF):
Income distribution statistics [e-publication].
ISSN=1799-1331. Income differentials between population subgroups 2013. Helsinki: Statistics Finland [referred: 19.4.2025].
Access method: http://stat.fi/til/tjt/2013/03/tjt_2013_03_2015-04-02_tie_003_en.html

