Published: 25 May 2015
Income differentials and poverty risk in Finland smaller than the European Union average
Income differentials in Finland are still smaller than the EU average even though they grew relatively rapidly by international comparison in the late 1990s. Every fourth EU citizen is at risk of poverty or social exclusion, while in Finland, 16 per cent of the population are at risk of poverty or social exclusion. These data derive from the results of the European Union Statistics on Income and Living Conditions, where Finland's data are based on Statistics Finland’s income distribution statistics.
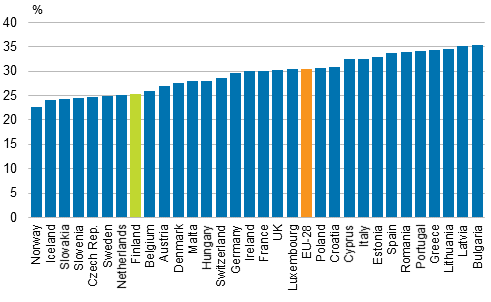
Income differentials in European countries 2012, Gini index (%)

Source: Eurostat, European Union Statistics on Income and Living Conditions (EU-SILC 2013, reference year for income 2012 except for the United Kingdom 2013). The Gini coefficient gets the value 0 if everyone receives the same amount of income and 100 if one income earner receives all the income. Income concept: disposable money income (excluding sales gains) per consumption unit.
In 2012, the smallest relative income differentials in Europe were found in Norway and Iceland and the largest in Bulgaria and Latvia. In Finland, the average income of the highest-income decile was 5.2-fold that of the lowest-income decile, while in the countries with high income differentials it was more than tenfold. The most common income differential indicator, the Gini index, was 25.4 in Finland when the average for EU Member States was 30.5. The higher the Gini coefficient, the bigger the income differentials are.
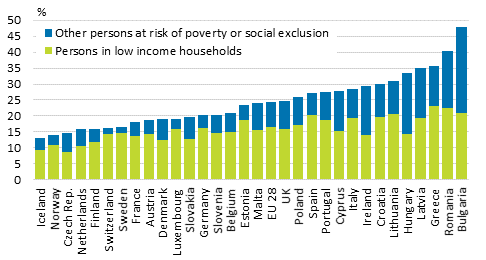
One in four EU citizens is at risk of poverty or social exclusion. In Finland, 16 per cent of the population were at risk of poverty or social exclusion in 2012. The share of the population at risk of poverty or social exclusion was highest in Bulgaria (48 per cent) and lowest in Iceland (13 per cent). People at risk of poverty or social exclusion include low income earners, those who are materially deprived or living in a household with low work intensity. Close on 17 per cent of the population in EU Member States were members of low income households in 2012 and Finland had the third lowest at-risk-of-poverty rate among EU countries, 11.7 per cent. In Greece, Romania, Bulgaria. Lithuania and Spain, more than one-fifth of the population were at risk of poverty.
Share of persons at risk of poverty or social exclusion divided to those living in low income households and others at risk of poverty or social exclusion in Europe in 2012

Source: Eurostat, European Union Statistics on Income and Living Conditions (EU-SILC 2013, reference year for income 2012 except for the United Kingdom 2013).
The so-called AROPE indicator (At Risk of Poverty or Social Exclusion) that measures the risk of poverty or social exclusion is part of the monitoring of the objective of the Europe 2020 Strategy. Persons are classified as being at-risk-of-poverty when they live in a household, whose disposable monetary income per consumption unit 1) is below 60 per cent of the national median income. Underemployed persons are all persons aged under 60, whose household's work input is below 20 per cent of the household's potential work input in the survey year. Potential work input refers to the combined theoretical working months of the household members aged between 18 and 59 (excl. dependent children aged between 18 and 24) per year. Persons, whose household suffers deprivation measured by at least four items out of nine are considered severely materially deprived. The indicators are: experiencing payment difficulties, difficulty coping with unexpected financial expenses or that the household cannot afford a telephone, washing machine, television, car, protein-rich meal every other day, one week's holiday per year or keep their home adequately warm.
1) The income of households that differ in size and structure has been divided by so-called consumption units. The consumption units are based on a scale used by Eurostat. One adult in the household is one consumption unit. Other persons in the household aged at least 14 are 0.5 consumption units each and children aged 0 to 13 are 0.3 consumption units each. A household with one adult member is one consumption unit, while a household consisting of spouses and one child aged under 14 together are 1.8 consumption units.
Source: Income Distribution Statistics 2013, Statistics Finland
Inquiries: Veli-Matti Törmälehto 029 551 3680, Kaisa-Mari Okkonen 029 551 3408
Director in charge: Riitta Harala
- Tables
-
Tables in databases
Pick the data you need into tables, view the data as graphs, or download the data for your use.
Updated 25.5.2015
Official Statistics of Finland (OSF):
Income distribution statistics [e-publication].
ISSN=1799-1331. Income, housing and housing expenditure 2013. Helsinki: Statistics Finland [referred: 19.4.2025].
Access method: http://stat.fi/til/tjt/2013/04/tjt_2013_04_2015-05-25_tie_001_en.html

