Published: 15 May 2008
Turnover in manufacturing increased by 9.9 per cent in December to February form the year before
Correction 15th of May 2008 at 2:30 p.m. Two numbers and the figure have been corrected.
According to Statistics Finland, turnover in manufacturing in the December to February period was 9.9 per cent higher than in the corresponding period of the year before. Domestic sales grew by 8.8 per cent and export turnover by 11.0 per cent from one year ago.
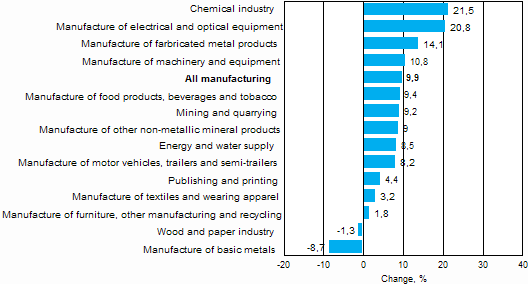
In December to February, turnover grew most in the chemical industry, by 21.5 per cent, and in the manufacture of electrical and optical equipment, by 20.81) per cent. Turnover grew briskly in all sub-industries of the metal industry apart from manufacture of basic metals, whose turnover contracted by 8.7 per cent from the year before. Of the other major industries, turnover in energy and water supply grew by 8.51) per cent and that in the wood and paper industry fell by 1.3 per cent from the year before.
Annual change in turnover in all manufacturing and in selected manufacturing industries during 12/2007-02/2008, % 2)

2) Data for the two industries Energy and water supply and Manufacture of furniture, other manufacturing and recycling were on the wrong rows.
The Index of turnover in industry describes enterprises whose main industry is manufacturing. The calculation of the indices is based on the Tax Administration's value added tax data which are supplemented with data obtained with Statistics Finland's sales inquiry. The monthly turnovers of manufacturing enterprises can vary considerably, especially in the metal industries. The variation is mainly due to invoicing practices. The final invoice of major machinery deliveries and projects may be recorded in the sales of one month, even if the delivery had required the work of several months or years.
As of the data released at the beginning of May 2008, monthly trend indicators have been calculated with a revised method. The revision affects both the calculation method and the calculation system of the indicators. Data concerning the latest month may have changed slightly because of the revised calculation method.
The main revisions to the calculation methods of the trend indicators concern the treatment of missing observations from the accumulation period, enterprise openings and closures, and foreign-owned enterprises. Further information on the methodological revision is available from Mr Antti Santaharju, tel. +358 9 1734 2720.
1) Numbers corrected, were before 20.9 and 1.8
Source: Monthly trend indicators 2008, February. Statistics Finland
Inquiries: Mr Matti Paavonen +358 9 1734 3553, Ms Merja Järvinen +358 9 1734 2458,volyymi.indeksi@stat.fi
Director in charge: Ms Hannele Orjala
- Tables
-
Tables in databases
Pick the data you need into tables, view the data as graphs, or download the data for your use.
Last updated 15.5.2008
Official Statistics of Finland (OSF):
Index of turnover in industry [e-publication].
ISSN=1798-596X. February 2008. Helsinki: Statistics Finland [referred: 13.3.2025].
Access method: http://stat.fi/til/tlv/2008/02/tlv_2008_02_2008-05-15_tie_001_en.html

