Wage and salary earners’ accidents at work
The risk of fatal accidents at work rose clearly
A total of 33 fatal accidents at work occurred to wage and salary earners in 2010. The number of fatal accidents at work rose clearly from the year before, as in 2009 accidents at work resulted in the death of 26 wage and salary earners. It should be noted that accidents in work traffic cannot always be separated from commuting accidents when settling claims. Therefore, some of the accidents that occur in work traffic are recorded as commuting accidents. The number of accidents in work in traffic has decreased from the early 1990s.
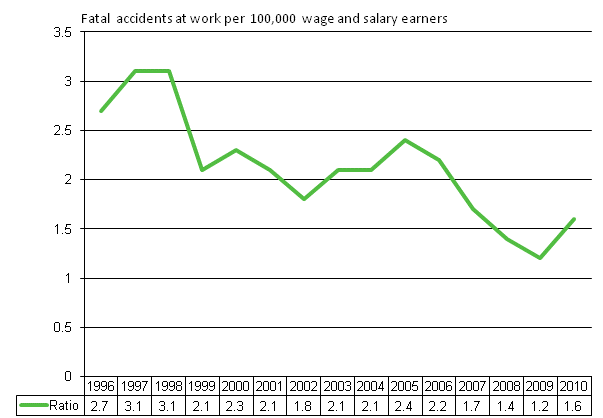
The risk of fatal accidents at work rose clearly. In 2010, an average of 1.6 per 100,000 wage and salary earners died in an accident at work (Figure 1). The respective figure was 1.2 in 2009. This means a growth of good one-third relative to the risk of fatal accidents at work in the previous year (33.3%). The difference between genders in fatal accidents at work is still clear: of the 33 fatal accidents at work 31 occurred to men and two to women. Fatal accidents at work concentrated on certain industries: six out of ten fatal accidents at work occurred in the activities of manufacturing (industry category C), construction (F) and transportation and storage (H). The risk of deaths at work has conventionally been particularly high in the construction industry. In 2010, there were 4.6 fatal accidents per 100,000 wage and salary earners in construction. In the industry of transportation and storage, the risk of fatal accidents at work was also 4.6. In the activity of wholesale and retail trade, 2.3 per 100,000 wage and salary earners, on the average, had a fatal accident at work (see Table 13).
The data by industry have been compiled by the revised Standard Industrial Classification TOL 2008 which was adopted in these statistics in the statistical reference year 2008. The data by the revised industrial classification are not comparable with those produced by its predecessor TOL 2002 (this applies to data from the reference year 2007 and prior to it).
Figure 1. Wage and salary earners' fatal accidents at work per 100,000 wage and salary earners in 1996–2010
The number and risk of wage and salary earners’ accidents at work rose slightly
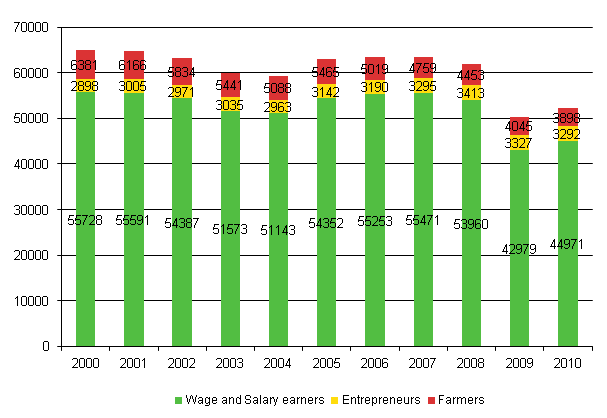
The number of wage and salary earners’ accidents at work was slightly higher in 2010 than one year earlier. In 2010, wage and salary earners had 44,971 accidents at work causing disability of at least four days. This was 1,992 accidents, or around five per cent, more than in 2009 (4.6%). Farmers’ accidents at work decreased by around 150 from the year before, and the number of accidents suffered by other self-employed people also fell slightly (Figure 2). However, it must be borne in mind that accident insurance is voluntary for self-employed persons, so the number of accidents at work may also indicate the popularity of insurance among self-employed persons. Around 40 per cent of self-employed persons are insured against accidents at work.
Figure 2. Changes in the number of accidents at work by status in employment in 2000–2010
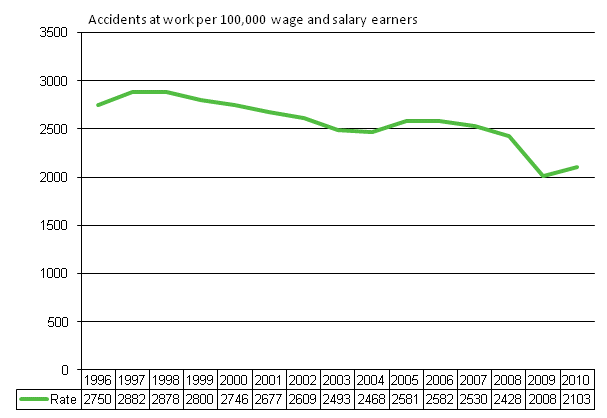
The risk of accidents at work has been falling among Finnish wage and salary earners since the late 1990s (Figure 3). This becomes evident when the number of accidents is expressed per 100,000 wage and salary earners. The accident incidence rate fell by some 14 per cent between 1998 and 2004. In 2010, a total of 2,103 accidents at work resulting in a disability of at least four days occurred per 100,000 wage and salary earners. The corresponding ratio in the previous year was 2,008, which means that the risk of accidents at work rose at the same rate as the total number of accidents (4.7%). The accident incidence rate is used to measure variation in the risks of accidents in different industries and occupational groups.
Figure 3. Accidents at work per 100,000 salary and wage earners in 1996–2010
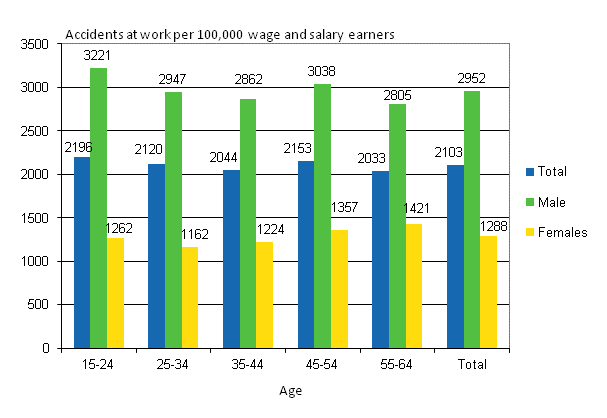
Accidents at work continue to be a problem among men: seven in ten accidents at work (68.7%) occur to men. Men’s risk of accidents at work has conventionally been clearly higher than women’s. Measured with the accident incidence rate, men’s risk of accidents at work is nearly 2.5-fold compared to women’s. The key reason is that more men than women work in industries and jobs with a higher than average accident risk.
Table 1. Wage and salary earners’ accidents at work by gender and age in 2010
| Age | Total | Males | Females | |||
| N | % | N | % | N | % | |
| Total | 44 971 | 100 | 30 874 | 100 | 14 097 | 100 |
| 15–24 | 5 496 | 12,2 | 3 822 | 12,4 | 1 674 | 11,9 |
| 25–34 | 10 285 | 22,9 | 7 652 | 24,8 | 2 633 | 18,7 |
| 35–44 | 9 976 | 22,2 | 6 988 | 22,6 | 2 988 | 21,2 |
| 45–54 | 11 600 | 25,8 | 7 747 | 25,1 | 3 853 | 27,3 |
| 55–64 | 7 353 | 16,4 | 4 487 | 14,5 | 2 866 | 20,3 |
| Others | 261 | 0,6 | 178 | 0,6 | 83 | 0,6 |
Among men, the risk of accidents at work is highest among the youngest age group (15 to 24). In 2010, young men had 3,221 accidents at work resulting in at least four days’ absence from work per 100,000 wage and salary earners (Figure 4). This meant that, measured with the accident incidence rate, the risk was almost 10 per cent higher than the average for all male wage and salary earners. The risk of accidents at work rose slightly from the previous year among all male wage and salary earners (3.8%). Unlike men’s, women’s risk of accidents is the highest among the oldest age group, that is, among those aged 55 to 64. However, differences between age groups are fairly small. Overall, the risk lessens almost steadily with increasing age. The picture drawn by the accident incidence rate of the situation with accidents at work by gender has remained nearly unchanged from one year to the next.
Figure 4. Wage and salary earners’ accidents at work per 100,000 wage and salary earners by gender and age in 2010
Building construction is still the riskiest
In 2010, the industries with a high risk of accidents at work when measured with accident frequency were postal and courier activities, (35.1), manufacture of wood and wood products (33.5) and construction (30.1). Figure 5 lists the industries with a higher than average (13.3) accident frequency. The frequencies have been calculated from accidents at work resulting in disability of at least four days, fatal accidents excluded. Municipal sector employees have been classified into their own category, as information on their industry is missing from the data files on accidents at work. Wage and salary earners in the municipal sector had 10.0 accidents at work per one million hours worked in 2010, while one year previously their accident frequency had been 9.9.
Figure 5. Wage and salary earners’ accidents at work per one million hours worked by industry in 2010, accident frequency higher than average
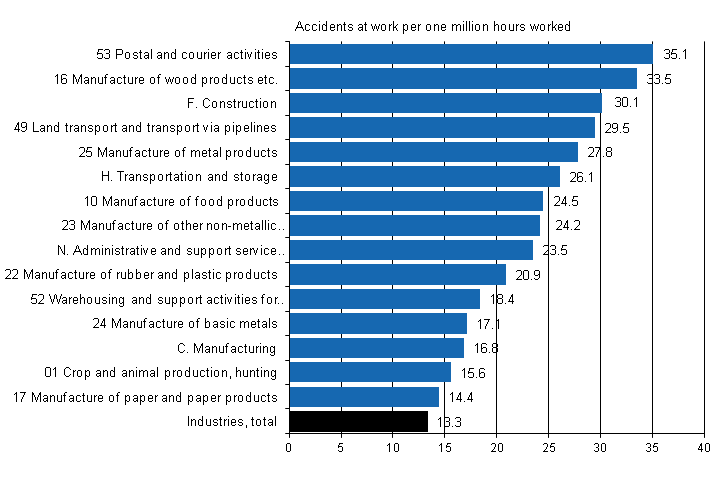
As with the accident incidence rate, the accident risk measured with the accident frequency has been falling almost steadily from the late 1990s. In previous year 2009, the accident frequency in industries totalled 12.9.
An examination by occupation (Figure 6) shows that the accident risk continues to be highest in the occupational group of building construction, where it is over four times as high as the average. In 2010, building construction workers had 8,716 accidents at work resulting in disability of at least four days per 100,000 wage and salary earners. One year earlier, this accident incidence rate was 8,404. In building construction occupations the accident risk measured by the accident incidence rate thus rose slightly (3.7%) from the previous year.
Next come occupational groups in food processing (6,919), agricultural and livestock work (6,497), wood work (5,871) and road traffic work (5,663). Measured by the accident incidence rate, the accident risk in wood processing occupations fell slightly (-2.8%) while the risk in agricultural occupations grew slightly (5.3%). In wood work occupations, and well as in road traffic work occupations the accident risk measured with the accidence incidence rate rose by more than one-tenth (14.5% and 12.7%, respectively). Figure 6 lists the occupational groups with a higher than average risk of accidents at work. On the average, 2,103 accidents at work resulting in disability of at least four days occurred per 100,000 wage and salary earners. As in the previous years, the number of accidents at work was highest in different occupational groups in manufacturing.
Figure 6. Wage and salary earners’ accidents at work per 100,000 wage and salary earners by occupation in 2010, accident incidence rate higher than average
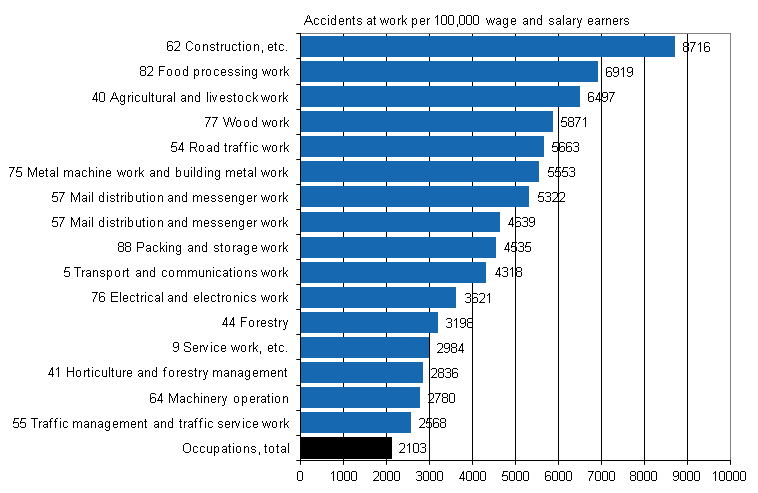
The accident frequency is a more accurate measure of risk than the accident incidence rate, as it expresses the number of accidents as a proportion of the time (hours worked) during which wage and salary earners were exposed to accidents at work. The hours worked, that is, the time of being exposed to accidents at work can, however, vary from person to person.
Previously Statistics Finland’s occupational accident statistics calculated the accident incidence rate by expressing the number of accidents at work resulting in at least three days’ absence from work as a proportion of 1,000 wage and salary earners. The key figures have been harmonised nationally and with Eurostat’s practice. The accident incidence rate is now expressed as the number of accidents at work resulting in disability of at least four days per 100,000 persons in the reference population. The accident frequency is expressed as the proportion of accidents at work resulting in at least four days’ absence from work of one million hours worked. The data on the number of wage and salary earners and their hours worked are obtained from Statistics Finland’s Labour Force Survey.
ESAW variables describing the circumstances and manner of accidents at work among wage and salary earners
A revised questionnaire on accidents at work was introduced in Finland in 2003 to collect for the first time data on the circumstances and manner of accidents at work according to the European Statistics on Accidents at Work (ESAW). These data are now published for the eighth time in these Occupational Accident Statistics for 2010. Compared with the previous year’s statistics the distributions of the variables are similar and thus appear fairly reliable. Eurostat’s project is ambitious and the data needing to be collected are quite detailed at times, which is why the presented data draw a comprehensive picture of the circumstances of an accident at work as well as of its causes and consequences.
The Member States are allowed to exercise discretion as to the extent of their data collection. In Finland the data on accidents at work are collected on the key ESAW variables, for some of them at the main category level only. The data are presented by the incidence process of an accident at work so that the prevailing circumstances are described first, then the progress of events and finally the consequences from the accident. In some variables, categories were combined for presentation reasons. The text section mainly presents distributions by gender. In addition to this, some data are presented by the national classification only. An example of such data are data on the variable describing the direct cause of the accident at work (see Table 6). An indication that they are in line with the joint European statistics on accidents at work is given in tables and figures based on the ESAW statistics.
Most accidents occur when the person is moving
Data are first presented about the general circumstances prior to the accident at work. The first ESAW variable describes the working process the wage and salary earner was involved in when the accident occurred. However, the working process does not refer to the person’s occupation because tasks may vary at different times in the same occupation. Nearly one-third (30.1%) of men’s accidents at work occurred in working processes related to production, manufacturing, processing or storing. More than one-half (51.0%) of women’s accidents at work took place in working processes related to public or private services (Table 2).
Table 2. Wage and salary earners’ accidents at work by gender and working process in 2010
| Working process | Total | Males | Females | |||
| N | % | N | % | N | % | |
| Total | 44 971 | 100 | 30 874 | 100 | 14 097 | 100 |
| 10 Production, manufacturing, processing, storing | 11 281 | 25,1 | 9 275 | 30,1 | 2 006 | 14,2 |
| 20 Excavation, construction, repair, demolition | 4 286 | 9,6 | 4 191 | 13,7 | 94 | 0,6 |
| 30 Agricultural type work, forestry, horticulture, fish farming, work with live animals | 1 462 | 3,2 | 858 | 2,8 | 603 | 4,1 |
| 40 Services provided to enterprise and/or to the general public; intellectual activity | 9 350 | 20,8 | 2 163 | 7,0 | 7 187 | 51,0 |
| 50 Other work related to tasks coded under 10, 20, 30 and 40 | 9 472 | 21,1 | 7 664 | 24,9 | 1 808 | 12,9 |
| 60 Movement, sport, artistic activity | 7 028 | 15,7 | 5 231 | 17,0 | 1 797 | 12,7 |
| 99 Other Working Processes no listed above | 687 | 1,5 | 458 | 1,5 | 229 | 1,6 |
| 00 No information | 1 405 | 3,1 | 1 034 | 3,3 | 371 | 2,6 |
The specific physical activity illustrates the person’s exact physical activity just before the moment of injury, while the working process variable describes the general nature of work at the time of the accident. The specific physical activity can be intentional or voluntary, but it need not be of long duration. According to the results (Table 3), nearly four in ten accidents occurred when the person was moving. A larger share (45.7%) of women’s than men’s (34.8%) accidents took place while in motion. Nearly every fifth (18.7%) accident occurred when the person was carrying a load by hand. Likewise, around one-fifth (18.5%) of accidents took place when handling diverse objects. In relative terms, men had over 50 per cent more accidents at work when working with hand-held tools than women did.
Table 3. Wage and salary earners’ accidents at work by gender and specific physical activity in 2010
| Specific physical activity | Total | Males | Females | |||
| N | % | N | % | N | % | |
| Total | 44 971 | 100 | 30 874 | 100 | 14 097 | 100 |
| 10 Operating machine | 1 884 | 4,2 | 1 579 | 5,1 | 305 | 2,2 |
| 20 Working with hand-held tools | 4 975 | 11,1 | 4 226 | 13,7 | 749 | 5,3 |
| 30 Driving/being on board a means of transport or handling equipment | 1 130 | 2,5 | 880 | 2,9 | 250 | 1,8 |
| 40 Handling of objects | 8 329 | 18,5 | 6 028 | 19,5 | 2 301 | 16,3 |
| 50 Carrying by hand | 8 405 | 18,7 | 5 556 | 18,0 | 2 849 | 20,2 |
| 60 Movement | 17 201 | 38,2 | 10 752 | 34,8 | 6 449 | 45,7 |
| 70 Presence | 1 057 | 2,4 | 587 | 1,9 | 470 | 3,3 |
| 99 Other Specific Physical Activities not listed above | 1 158 | 2,6 | 663 | 2,1 | 495 | 3,5 |
| 00 No information | 832 | 1,9 | 603 | 2,0 | 229 | 1,6 |
The cause of accident most often stumbling, slipping or falling
We will next examine the progress of the events leading to the actual accident at work. Among women good one-third (35.4%) and among men some 30 per cent (30.5%) of accidents at work were consequences from stumbling, jumping, slipping or falling (Table 4). The proportions are nearly the same as one year earlier. This comes clear from data on the “deviation” variable which describes an unusual occurrence during the physical activity that lead to the accident at work. If several deviating events precede the actual accident, the one that occurred last is recorded. The second most common event leading to an accident was sudden physical stress for both men (18.9%) and women (22.8%).
Table 4. Wage and salary earners’ accidents at work by gender and deviation in 2010
| Deviation | Total | Males | Females | |||
| N | % | N | % | N | % | |
| Total | 44 971 | 100 | 30 874 | 100 | 14 097 | 100 |
| 10 Deviation due to electrical problems, explosion, fire | 109 | 0,2 | 102 | 0,3 | 7 | 0,0 |
| 20 Deviation by overflow, overturn, leak, flow, vaporisation, emission | 1 113 | 2,5 | 814 | 2,6 | 299 | 2,1 |
| 30 Breakage, bursting, splitting, slipping, fall, collapse of Material Agent | 4 857 | 10,8 | 3 640 | 11,8 | 1 217 | 8,6 |
| 40 Loss of control (total or partial) of machine, means of transport or handling equipment, hand-held tool, object, animal | 5 164 | 11,5 | 4 077 | 13,2 | 1 087 | 7,7 |
| 50 Slipping – Stumbling and falling – Fall of persons | 14 418 | 32,1 | 9 423 | 30,5 | 4 995 | 35,4 |
| 60 Body movement without any physical stress (generally leading to an external injury) | 6 858 | 15,2 | 5 016 | 16,2 | 1 842 | 13,1 |
| 70 Body movement under or with physical stress (generally leading to an external injury) | 9 048 | 20,1 | 5 831 | 18,9 | 3 217 | 22,8 |
| 80 Shock, fright, violence, aggression, threat, presence | 1 215 | 2,7 | 461 | 1,5 | 754 | 5,3 |
| 99 Other Deviations not listed above | 1 601 | 3,6 | 1 098 | 3,6 | 503 | 3,6 |
| 00 No information | 588 | 1,3 | 412 | 1,3 | 176 | 1,2 |
Roughly three in ten (29.6%) of the victims of accidents at work were injured due to horizontal or vertical impact with or against a stationary object (Table 5). This is also indicated in the data on the variable expressing the deviating situation leading to the accident, where stumbling, falling or similar was the most common event leading to the accident. With a few exceptions, the data on these two variables are almost identical for men and women. Roughly every fourth (25.7%) was injured as a result of sudden physical or mental stress. The mode of injury describes how the injured body part came into contact with the cause of the injury. Where there are several modes of injury, the one causing the most serious injury is recorded.
Table 5. Wage and salary earners' accidents at work by gender and contact - mode of injury in 2010
| Contact - Mode of injury (ESAW) | Total | Males | Females | |||
| N | % | N | % | N | % | |
| Total | 44 971 | 100 | 30 874 | 100 | 14 097 | 100 |
| 10 Contact with electrical voltage, temperature, hazardous substances | 1 270 | 2,8 | 850 | 2,8 | 420 | 3,0 |
| 20 Drowned, buried, enveloped | 7 | 0,0 | 6 | 0,0 | 1 | 0,0 |
| 30 Horizontal or vertical impact with or against a stationary object (the victim is in motion) | 13 321 | 29,6 | 8 667 | 28,1 | 4 654 | 33,0 |
| 40 Struck by object in motion, collision with | 4 404 | 9,8 | 3 324 | 10,8 | 1 080 | 7,7 |
| 50 Contact with sharp, pointed, rough, coarse Material Agent | 6 611 | 14,7 | 5 148 | 16,7 | 1 463 | 10,4 |
| 60 Trapped, crushed, etc. | 4 766 | 10,6 | 3 534 | 11,4 | 1 232 | 8,7 |
| 70 Physical or mental stress | 11 536 | 25,7 | 7 594 | 24,6 | 3 942 | 28,0 |
| 80 Bite, kick, etc. (animal or human) | 1 091 | 2,4 | 416 | 1,3 | 675 | 4,8 |
| 99 Other Contacts – Modes of Injury not listed in above | 1 561 | 3,5 | 1 059 | 3,4 | 502 | 3,6 |
| 00 No information | 404 | 0,9 | 276 | 0,9 | 128 | 0,9 |
In one-third of wage and salary earners’ accidents at work - in 32.5 per cent among men and in 37.2 per cent among women - the direct material agent of the injury was diverse scaffolding, surfaces and planes. Various materials, objects and supplies injured slightly over one-quarter of the victims of accidents at work (Table 6).
The data on the material agent of contact describes the physical factor with which the injured body part was in contact. When several modes are involved persons filling in the accident notification form are asked to report the material agent of the most serious injury.
Table 6. Wage and salary earners' accidents at work by gender and material agent of contact - mode of injury in 2010
| Material Agent of Contact-Mode of injury (FAII) 1) | Total | Males | Females | |||
| N | % | N | % | N | % | |
| Total | 44 971 | 100 | 30 874 | 100 | 14 097 | 100 |
| 1100–1399 Scaffolding, surfaces and planes | 15 266 | 33,9 | 10 023 | 32,5 | 5 243 | 37,2 |
| 2100–2799 Tools, machines and equipment | 7 114 | 15,9 | 5 852 | 18,9 | 1 262 | 8,9 |
| 2801–2899 Conveying, transport and storage equipment | 2 037 | 4,6 | 1 379 | 4,4 | 658 | 4,7 |
| 3100, 3200 Transport equipment | 1 473 | 3,3 | 1 198 | 3,9 | 275 | 2,0 |
| 4100–4400 Materials, objects and supplies | 11 671 | 26,0 | 8 635 | 27,9 | 3 036 | 21,5 |
| 5100 Living organisms and human-beings | 3 042 | 6,8 | 929 | 3,0 | 2 113 | 15,0 |
| 5200 Bulk waste | 177 | 0,4 | 146 | 0,5 | 31 | 0,2 |
| 5300 Physical phenomena and natural elements | 399 | 0,9 | 264 | 0,9 | 135 | 1,0 |
| 9999 Other material agents not listed above | 2 733 | 6,1 | 1 750 | 5,7 | 983 | 7,0 |
| 0000 No information | 1 059 | 2,4 | 698 | 2,3 | 361 | 2,6 |
The classification describing the material agent is national for accident data on wage and salary earners. The classification is considerably more detailed than previously. Two things should be borne in mind when examining the results. First, the occurrence of an accident at work is usually a sum of many factors and no single material agent can always be identified unambiguously. However, the data on the variable show what kind of equipment or tools the victim was using or in what kind of working environment the accident occurred. Second, inadequate guidance or inexperience on the part of the worker can often play a major role in the occurrence of an accident. It is difficult and often impossible to produce statistics on such factors.
Four out of ten (43.6%) injuries caused by accidents at work were dislocations, sprains or strains (Table 7). The next most common were wounds and superficial injuries (24.9%), and diverse concussions and internal injuries (15.6%) . Men’s accidents caused relatively more often various wounds and superficial injuries, while women’s accidents caused dislocations, sprains and strains. This is concordant with the results presented above, which showed that men more often than women injure themselves in accidents at work in connection with sharp objects whereas women more than men injure themselves by stumbling or slipping.
Table 7. Wage and salary earners’ accidents at work by gender and type of injury in 2010
| Type of Injury (ESAW) | Total | Males | Females | |||
| N | % | N | % | N | % | |
| Total | 44 971 | 100 | 30 874 | 100 | 14 097 | 100 |
| 010 Wounds and superficial injuries | 11 218 | 24,9 | 8 381 | 27,1 | 2 837 | 20,1 |
| 020 Bone fractures | 4 436 | 9,9 | 3 159 | 10,2 | 1 277 | 9,1 |
| 030 Dislocations, sprains and strains | 19 606 | 43,6 | 12 809 | 41,5 | 6 797 | 48,2 |
| 040 Traumatic amputations (Loss of body parts) | 174 | 0,4 | 152 | 0,5 | 22 | 0,2 |
| 050 Concussions and internal injuries | 7 011 | 15,6 | 4 781 | 15,5 | 2 230 | 15,8 |
| 060 Burns, scalds and frostbites | 984 | 2,2 | 606 | 2,0 | 378 | 2,7 |
| 070 Poisonings and infections | 101 | 0,2 | 80 | 0,3 | 21 | 0,1 |
| 080 Drowning and asphyxiations | 1 | 0,0 | – | – | 1 | 0,0 |
| 090 Effects of sound, vibration and pressure | 11 | 0,0 | 8 | 0,0 | 3 | 0,0 |
| 100 Effects of temperature extremes, light and radiation | 13 | 0,0 | 11 | 0,0 | 2 | 0,0 |
| 110 Shocks | 112 | 0,2 | 56 | 0,2 | 56 | 0,4 |
| 120 Multiple injuries | 181 | 0,4 | 111 | 0,4 | 70 | 0,5 |
| 999 Other specified injuries not included under other headings | 247 | 0,5 | 163 | 0,5 | 84 | 0,6 |
| 000 No information | 876 | 1,9 | 557 | 1,8 | 319 | 2,3 |
More than four out of ten accidents at work (42.9%) involved the upper extremities (Table 8). Under 30 per cent (29.3%) injure the lower extremities, including hips, thighs, knees, shins and ankles.
Table 8. Wage and salary earners' accidents at work by gender and injured body part in 2010
| Part of Body Injured (ESAW) | Total | Males | Females | |||
| N | % | N | % | N | % | |
| Total | 44 971 | 100 | 30 874 | 100 | 14 097 | 100 |
| 10 Head | 1 660 | 3,7 | 1 256 | 4,1 | 404 | 2,9 |
| 20 Neck | 505 | 1,1 | 314 | 1,0 | 191 | 1,4 |
| 30 Back, spine | 6 386 | 14,2 | 4 132 | 13,4 | 2 254 | 16,0 |
| 40 Torso, internal organs | 2 241 | 5,0 | 1 729 | 5,6 | 512 | 3,6 |
| 50 Upper extremities | 19 283 | 42,9 | 13 671 | 44,3 | 5 612 | 39,8 |
| 60 Lower extremities | 13 182 | 29,3 | 8 817 | 28,6 | 4 365 | 31,0 |
| 70 Entire body or several body parts | 1 309 | 2,9 | 705 | 2,3 | 604 | 4,3 |
| 99 Others | 115 | 0,3 | 55 | 0,2 | 60 | 0,4 |
| 00 Data missing | 290 | 0,6 | 195 | 0,6 | 95 | 0,7 |
Average duration of absence from work 12 days
The seriousness of accidents at work can be assessed based on the duration of disability resulting from them. The figures prior to 2002 describing the length of absence from work are not fully comparable with the figures for 2002 to 2010, because it was not previously possible to distinguish cases leading to employment accident pension. The cases leading to employment accident pension are always serious but in some of the cases the recorded number of days of absence may have been low before the decision on the pension was granted. Today, pension cases are excluded from the examination of duration of disability.
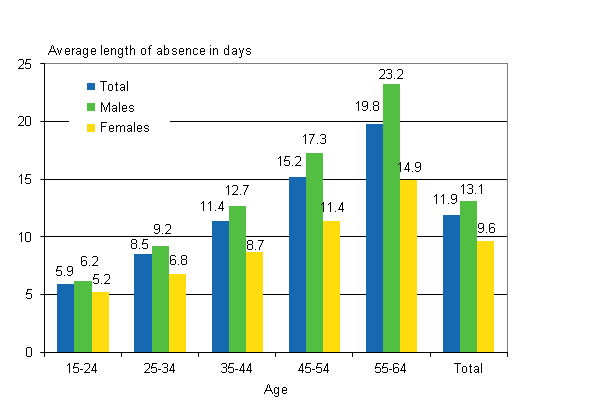
The average duration of absence from work due to an accident at work was 12 (11.9) days in 2010. The average duration of disability was 13.1 days for men and 9.6 days for women. The average duration of absence caused by accidents increased with age among both men and women (Figure 7). Included are also accidents at work leading to a disability of under four days.
Figure 7. Average duration of disability caused by wage and salary earners’ accidents at work by gender and age in 2010
Slightly under one-third (29.7%) of all accidents leading to disability of at least four days caused disability of four to six days, and around 18.1 per cent of the accidents – including employment accident pension cases – were serious, causing absences of more than 30 days (Table 9).
Table 9. Wage and salary earners’ accidents at work by gender and length of disability in 2010
| Duration of disability - days | Total | Males | Females | |||
| N | % | N | % | N | % | |
| Total | 44 971 | 100 | 30 874 | 100 | 14 097 | 100 |
| 4–6 days | 13 376 | 29,7 | 8 871 | 28,7 | 4 505 | 32,0 |
| 7–14 days | 15 973 | 35,5 | 10 831 | 35,1 | 5 142 | 36,5 |
| 15–30 days | 7 453 | 16,6 | 5 279 | 17,1 | 2 174 | 15,4 |
| 31–90 days | 5 660 | 12,6 | 4 024 | 13,0 | 1 636 | 11,6 |
| 91–182 days | 1 490 | 3,3 | 1 080 | 3,5 | 410 | 2,9 |
| 183–365 days | 909 | 2,0 | 703 | 2,3 | 206 | 1,5 |
| Employment accident pension | 110 | 0,2 | 86 | 0,3 | 24 | 0,2 |
Risk of commuting accidents grew slightly
In 2010, wage and salary earners had a total of 19,550 commuting accidents for which insurance companies paid compensation. In statistics commuting accidents are separated from accidents at work and accidents while in work traffic. A commuting accident means an accident on the journey between home and work. Due to incomplete information on claims forms, some commuting accidents are in practice recorded as accidents at work and vice versa.
The number of commuting accidents resulting in disability of at least four days grew slightly (2.9%) from 2009. By contrast, the number of fatal commuting accidents increased by nearly two-thirds (63.6%) from the previous year. In 2010, a total of 18 wage and salary earners died while commuting whereas in 2009 the corresponding number was 11. In 2008, the respective figure was 18 and in 2007 fatal commuting accidents numbered 25. Thus, the number of commuting accidents varies greatly by year.
Commuting accidents differ from accidents at work in that they are more common among women than men: nearly two-thirds (68.7%) of all commuting accidents occurred to women. By contrast, twice as many fatal commuting accidents occurred to men (12) than to women (6).
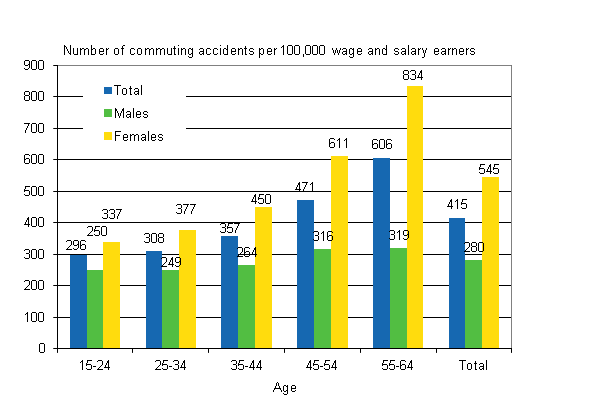
The accident incidence rate of commuting accidents grew slightly (4.0%) from the previous year. In 2010, there were 415 commuting accidents per 100,000 wage and salary earners. In 2009, the corresponding figure was 399. Women had 545 (508 in 2009) and men 280 (284 in 2009) commuting accidents per 100,000 wage and salary earners. Like the number of fatal commuting accidents, the accident incidence rate of commuting accidents varies clearly by year.
The difference between men and women stays the same when looking at the accident incidence rates in different age groups (Figure 8). Both men’s and women’s risk of commuting accidents increases with age, but women’s risk is still higher than men’s in all age groups. The risk of being injured on the way to or from work is 2.5-fold among women aged 55 to 64 in comparison with the youngest age group. The relative difference between men and women is also largest in the oldest age group.
Figure 8. Wage and salary earners’ commuting accidents per 100,000 wage and salary earners by gender and age in 2010
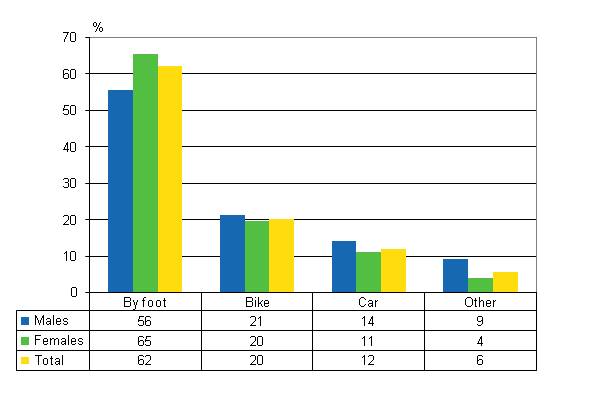
Most commuting accidents occur when walking or cycling: more than six out of ten (62%) of those injured in commuting accidents were walking and good one-fifth (20%) were cycling when injured. When comparing men and women by mode of transport there were no major differences in commuting accidents: women were slightly more often injured when walking than men, whereas slightly more of men’s than women’s accidents occurred in passenger car accidents (Figure 9). It is not possible to take into account in statistics the differences between women and men in their frequency of using a bicycle or a car on the journey between home and work.
Figure 9. Wage and salary earners’ commuting accidents by mode of travel and gender in 2010
When considering the modes of travel it is natural that the most common type of accident is falling, slipping or stumbling. In 2010, three-quarters (75.1%) of all commuting accidents resulted from falling or slipping. The second most common type (10.9%) of accident is ’collision with a car’ (Table 10).
Table 10. Wage and salary earners’ commuting accidents by gender and type of accident in 2010
| Type of accident | Total | Males | Females | |||
| N | % | N | % | N | % | |
| Total | 8 769 | 100 | 2 904 | 100 | 5 865 | 100 |
| Falling, slipping or stumbling | 6 587 | 75,1 | 2 094 | 72,1 | 44 93 | 76,6 |
| Stepping on objects | 56 | 0,6 | 19 | 0,7 | 37 | 0,6 |
| Driving off the road or car falling over | 527 | 6,0 | 220 | 7,6 | 3 07 | 5,2 |
| Collision with a car | 960 | 10,9 | 370 | 12,7 | 590 | 10,1 |
| Collision with a bicycle, moped, etc. | 159 | 1,8 | 38 | 1,3 | 121 | 2,1 |
| Collision with a track-going vehicle | 1 | 0,0 | – | – | 1 | 0,0 |
| Violence | 21 | 0,2 | 8 | 0,3 | 13 | 0,2 |
| Others | 458 | 5,2 | 155 | 5,3 | 303 | 5,2 |
Most of the injuries sustained in commuting accidents were minor, often caused by falling. In more than four cases out of ten, the victim’s injuries were diverse dislocations of joints, sprains and strains (Table 11). The injured body parts were often the extremities (Table 12).
Table 11. Wage and salary earners’ commuting accidents by gender and type of injury in 2010
| Type of Injury (ESAW) | Total | Males | Females | |||
| N | % | N | % | N | % | |
| Total | 8 769 | 100 | 2 904 | 100 | 5 865 | 100 |
| 010 Wounds and superficial injuries | 845 | 9,6 | 258 | 8,9 | 587 | 10,0 |
| 020 Bone fractures | 1 735 | 19,8 | 579 | 19,9 | 1 156 | 19,7 |
| 030 Dislocations, sprains and strains | 3 914 | 44,6 | 1 340 | 46,1 | 2 574 | 43,9 |
| 040 Traumatic amputations (Loss of body parts) | 2 | 0,0 | – | – | 2 | 0,0 |
| 050 Concussions and internal injuries | 1 787 | 20,4 | 564 | 19,4 | 1 223 | 20,9 |
| 060 Burns, scalds and frostbites | 7 | 0,1 | 3 | 0,1 | 4 | 0,1 |
| 070 Poisonings and infections | 2 | 0,0 | 1 | 0,0 | 1 | 0,0 |
| 090 Effects of sound, vibration and pressure | – | – | – | – | – | – |
| 110 Shocks | 11 | 0,1 | 3 | 0,1 | 8 | 0,1 |
| 120 Multiple injuries | 137 | 1,6 | 49 | 1,7 | 88 | 1,5 |
| 999 Other specified injuries not included under other headings | 28 | 0,3 | 10 | 0,3 | 18 | 0,3 |
| 000 No information | 301 | 3,4 | 97 | 3,3 | 204 | 3,5 |
Table 12. Wage and salary earners’ commuting accidents by gender and injured body part in 2010
| Part of Body Injured (ESAW) | Total | Males | Females | |||
| N | % | N | % | N | % | |
| Total | 8 769 | 100 | 2 904 | 100 | 5 865 | 100 |
| 10 Head | 298 | 3,4 | 83 | 2,9 | 215 | 3,7 |
| 20 Neck | 434 | 4,9 | 138 | 4,8 | 296 | 5,0 |
| 30 Back, spine | 774 | 8,8 | 305 | 10,5 | 469 | 8,0 |
| 40 Torso, internal organs | 629 | 7,2 | 273 | 9,4 | 356 | 6,1 |
| 50 Upper extremities | 2 403 | 27,4 | 795 | 27,4 | 1 608 | 27,4 |
| 60 Lower extremities | 3 164 | 36,1 | 1 015 | 35,0 | 2 149 | 36,6 |
| 70 Entire body or several body parts | 873 | 10,0 | 235 | 8,1 | 638 | 10,9 |
| 99 Others | 22 | 0,3 | 6 | 0,2 | 16 | 0,3 |
| 00 Data missing | 172 | 2,0 | 54 | 1,9 | 118 | 2,0 |
Source: Occupational accident statistics 2010, Statistics Finland
Inquiries: Tarja Seppänen 09 1734 3220, tyotapaturmat@stat.fi
Director in charge: Riitta Harala
Updated 30.11.2012
Official Statistics of Finland (OSF):
Occupational accident statistics [e-publication].
ISSN=1797-9544. 2010,
Wage and salary earners’ accidents at work
. Helsinki: Statistics Finland [referred: 26.4.2025].
Access method: http://stat.fi/til/ttap/2010/ttap_2010_2012-11-30_kat_001_en.html

