This set of statistics has been discontinued.
New data are no longer produced from the statistics.
Published: 21 March 2013
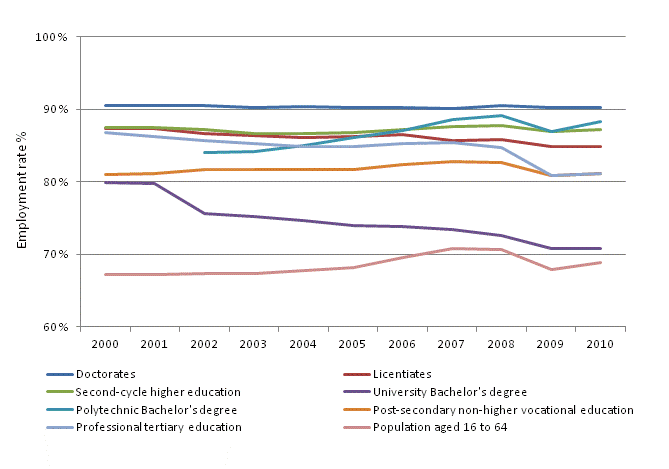
Employment rate of highly educated people is high
According to Statistics Finland, the employment rate of those with
tertiary level degrees was 83.8 per cent in 2010. The figure was 15
percentage points higher than for people aged 15 to 64, on average.
The employment rate has, as a rule, improved in all levels of
education up to the recession in 2008, after which the employment
rate of those with lower-level tertiary qualifications, in
particular, decreased temporarily. The employment rate of doctors
has remained high, at over 90 per cent throughout the decade. The
employment rate of those with polytechnic degrees and higher-level
university degrees is also at a record level.
Employment rate of those with tertiary level degrees by level of qualification in 2000-2010
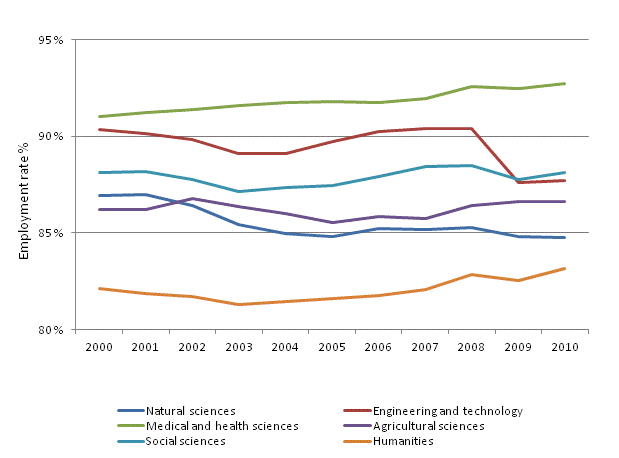
The employment rate of those with higher-level tertiary qualifications and postgraduate level degrees in the field of technology dropped by some three percentage points due to the recession, to 88 per cent. The development of the employment rate among those with degrees from natural sciences has also been descending. Their employment rate decreased by two percentage points during the 2000s, and was slightly under 85 per cent in 2010. The employment rate of those with higher-level tertiary qualifications within the fields of medical and health grew to nearly 93 per cent by the end of the reference period. The employment rate of those who had studied humanities also improved.
Employment rate of those with higher-level tertiary qualifications and postgraduate level degrees by field of science in 2000-2010
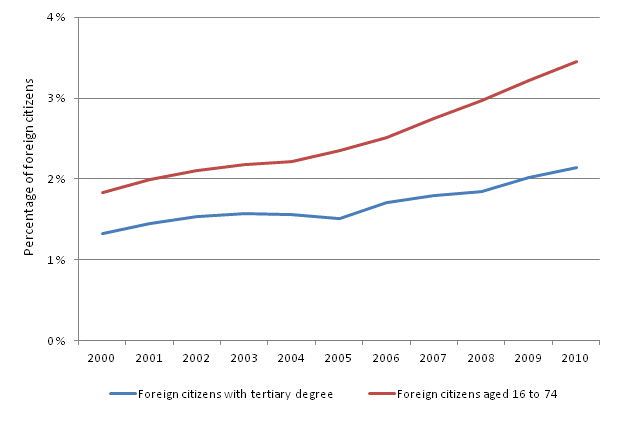
There were 1.19 million people with tertiary level degrees in 2010. Of these, good two per cent were foreign citizens. The share of foreign citizens has grown by one percentage point over a decade. Over the same period, the share of all foreign citizens aged between 16 and 74 has increased by 1.7 percentage points. A majority of the foreigners, 37 per cent, came from EU countries. Thirty per cent came from other European countries, 19 per cent from Asia, and 14 per cent from other parts of the world.
Share of highly educated foreign citizens of the population in 2000-2010
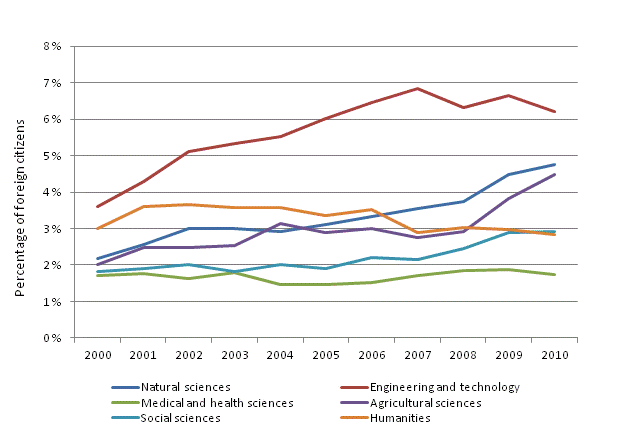
The share of employed foreign citizens with higher-level tertiary qualifications and post-graduate level degrees in their own reference group grew steadily in the 2000s, apart from those with degrees in humanities. Differences between fields of science were small. In the fields of medical and health and technology, foreign citizens with a degree represented a slightly higher share. Social sciences, in turn, attracted in relative terms somewhat fewer foreign citizens to Finland than other fields. This was due to the large number of teachers in the field of social sciences. When looking at the people with the highest level of education, doctors, the situation changes. The share of foreign doctors of science in technology among all doctors of science in technology increased by three percentage points over a decade, stabilising at around 6.5 per cent. The share of foreign doctors of medical sciences has remained low, below two per cent throughout the reference period.
Share of employed persons among those with higher-level tertiary qualifications and post-graduate level degrees by field of science in 2000-2010
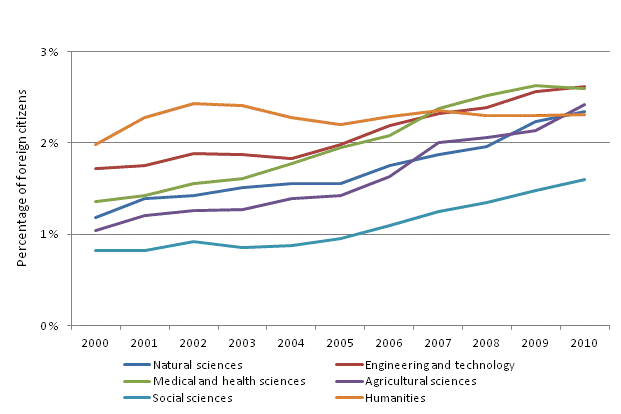
Share of employed persons among foreign citizens with doctor's degrees by field of science in 2000-2010
Source: Human resources of science and technology 2011. Statistics Finland
Inquiries: Marianne Kaplas 09 1734 3421
Director in charge: Hannele Orjala
Publication in pdf-format (12 pages 360.6 kB)
- Tables
-
Tables in databases
Pick the data you need into tables, view the data as graphs, or download the data for your use.
Appendix tables
- Appendix table 1. Tertiary degrees by the field of science in 1991, 2000 and 2011 (21.3.2013)
- Appendix table 2. Population with a tertiary degree in 2000 and 2010 (21.3.2013)
- Appendix table 3. Population with a tertiary degree by principal activity in 2010 (21.3.2013)
- Appendix table 4. Employed population with tertiary level education in 2010 (21.3.2013)
- Figures
-
- Appendix figure 1. Doctorate and licentiate degrees in 1994 - 2011 (21.3.2013)
- Appendix figure 2. Doctorate level degrees by gender 1992 - 2011 (21.3.2013)
- Appendix figure 3. Persons with doctorate degree, median ages by the field of science in 1992 - 2011 (21.3.2013)
- Appendix figure 4. Persons with tertiary degrees as a proportion of the population aged 16 to 74 in 2000 - 2010 (21.3.2013)
- Appendix figure 5. Unemployment rates of persons with doctorate level and higher-degree level tertiary education by the field of science in 2010 (21.3.2013)
- Appendix figure 6. Persons with doctorate level and higher-degree level tertiary education as a percentage by the field of science in 2010 (21.3.2013)
Updated 21.03.2013
Official Statistics of Finland (OSF):
Human resources of science and technology [e-publication].
ISSN=1797-3244. 2011. Helsinki: Statistics Finland [referred: 19.4.2025].
Access method: http://stat.fi/til/tthv/2011/tthv_2011_2013-03-21_tie_001_en.html

