This set of statistics has been discontinued.
New data are no longer produced from the statistics.
Published: 9 June 2009
Number of telecommunications subscriptions in Finland quadrupled in 20 years
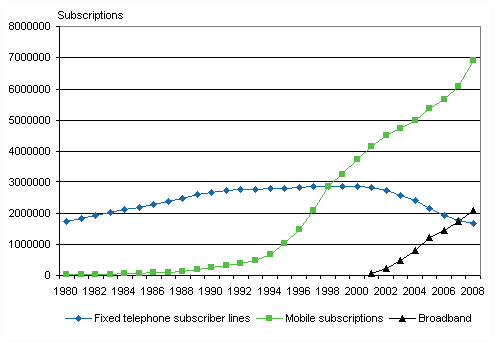
In 1988 there were a total of nearly 2.6 million telephone subscriptions in Finland; fixed telephone network subscriptions numbered nearly 2.5 million and mobile phone subscriptions some 140,000. In the past two decades, communication has changed from location-specific use of telephones to a more varied kind of communication not bound to a certain location in which non-voice services and data transmission have an increasingly important role alongside voice services. At the end of 2008 there were already over 10 million telecommunications subscriptions in Finland; fixed telephone network subscriptions numbered close on 1.7 million, mobile phone subscriptions 6.9 million and broadband subscriptions nearly 2.1 million.
In 2008 the use of services in the mobile communication network increased again from previous years. The number of calls from mobile phones increased by 3 per cent from the year before and call minutes increased by some 8 per cent. The number of text and multimedia messages sent increased as well; by 12 and 32 per cent, respectively, from the year 2007. The volume of data transmitted in the mobile phone network grew tenfold from 2007 volumes. This growth was supported by the increase in mobile broadband subscriptions in 2008. At the end of the year the number of mobile broadband subscriptions was reported at nearly 490,000, while one year previously their number was some 140,000.
The number of personnel of telecommunications operators fell by 11 per cent from the year before in 2008. Turnover contracted by some 5 per cent from that in 2007. Telecommunications network operators’ investments in network and other tangible assets stayed on level with the year before.
Fixed telephone subscriptions and mobile phone subscriptions in 1980-2008 and broadband subscriptions on 2001-2008

In the above figure mobile broadband subscriptions are included in both broadband and mobile phone subscriptions.
Source: Telecommunications 2008, Statistics Finland
Inquiries: Mervi Niemi (09) 1734 3263, Kari-Pekka Niemi (09) 1734 3399, tiede.teknologia@stat.fi
Director in charge: Leena Storgårds
Publication in pdf-format (17 pages 353.5 kB)
- Reviews
-
- Subscriber lines and subscriptions (9.6.2009)
- Volume of services (9.6.2009)
- Personnel and finances of telecommunications operators (9.6.2009)
- Tables
-
Appendix tables
- Table 1. Number of fixed telephone subscriber lines, number of subscriber lines per 100 population and share of ISDN channels of all fixed lines in 1990, 1995 and 2000-2008 (9.6.2009)
- Table 2. Numbers of ISDN basic and primary subscriber lines in 1995 and 2000-2008 (9.6.2009)
- Table 3. Broadband subscriptions in 2001-2008 (9.6.2009)
- Table 4. Broadband access in OECD countries per 100 inhabitants in 2003-2008 (9.6.2009)
- Table 5. Number of mobile phone subscriptions and number of subscriptions per 100 population in 1980, 1985 and 1990-2008 (9.6.2009)
- Table 6. Total number of outgoing calls from (fixed) local networks and average length of call in 1995-2008 (9.6.2009)
- Table 7. Outgoing calls from local fixed networks in 2008 (9.6.2009)
- Table 8. Number of outgoing mobile phone calls, change from previous year and average length of call in 1995-2008 (9.6.2009)
- Table 9. Numbers of outgoing short messages and multimedia messages from mobile phones in 2002-2008 (9.6.2009)
- Table 10. Personnel of telecommunications operators in 1995-2008 (9.6.2009)
- Table 11. Turnover and breakdown of turnover of telecommunications operators in 2008 (9.6.2009)
- Table 12. Investments of telecommunications operators in tangible assets and telecommunication networks in 2003-2008, EUR million (9.6.2009)
- Table 13. Number of employees and value of gross output of manufacture of telecommunications equipment (SIC 322) in 1995-2007 (9.6.2009)
- Table 14. Import and export of telecommunications equipment in 1995-2008, EUR million (9.6.2009)
- Figures
-
- Figure 1. Numbers of fixed line and mobile telephone subscriptions in 1995-2008 (9.6.2009)
- Figure 2. The distribution of calls from local telephone networks in 2003-2008, per cent (9.6.2009)
- Figure 3. The distribution of call minutes from local telephone networks in 2003-2008, per cent (9.6.2009)
- Figure 4. Numbers of outgoing calls from the local telephone network and from mobile phones in 1995-2008 (9.6.2009)
- Figure 5. Numbers of outgoing call minutes from the local telephone network and from mobile phones in 1995-2008 (9.6.2009)
- Figure 6. Numbers of outgoing calls from private (domestic) subscriptions and corporate subscriptions in 2008, per cent (9.6.2009)
- Figure 7. Numbers of outgoing calls from mobile phones in 2008, per cent (9.6.2009)
- Figure 8. Numbers of outgoing short messages from mobile phones and short messages per subscription on average from mobile phones in 2002-2008 (9.6.2009)
- Figure 9. Investments of telecommunications operators in tangible assets and telecommunication networks in 2003-2008, EUR million (9.6.2009)
Updated 9.6.2009
Official Statistics of Finland (OSF):
Telecommunications [e-publication].
2008. Helsinki: Statistics Finland [referred: 20.4.2025].
Access method: http://stat.fi/til/tvie/2008/tvie_2008_2009-06-09_tie_001_en.html

