This set of statistics has been discontinued.
New data are no longer produced from the statistics.
Published: 19 December 2012
Direct taxes increased by 4 per cent
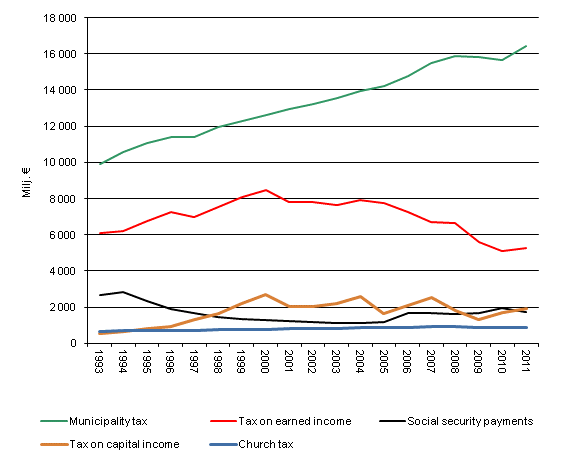
Income earners paid EUR 26.2 billion in direct taxes and payments in 2011. Municipal taxes accounted for the largest share of direct taxes and amounted to EUR 16.4 billion. The taxes on earned income were EUR 5.3 billion and taxes on capital income EUR 1.9 billion. Income earners paid EUR 1.0 billion in healthcare contributions and EUR 665 million in earned-income contribution payments.
Taxes grew by four per cent from the previous year. Five per cent more was paid in municipal taxes and three per cent more in taxes on earned income. The amount of taxes on capital income increased most, by 13 per cent. Compared to last year, 15 per cent less was paid in healthcare contributions and eight per cent less in earned-income contribution payments.
Income earners' direct taxes in 1993–2011, at 2011 prices

Taxes and payments have increased by 32 per cent in real terms from 1993. Municipal taxes have clearly grown most by 66 per cent. The share of municipal taxes of all taxes has increased from 50 to 63 per cent. At the same time, the share of state taxes has decreased from 33 to 27 per cent. The share of taxes on earned income has fallen from 31 to 20 per cent.
The share of taxes and payments of taxable income for income earners was 21.7 per cent in 2011, while it was 21.9 per cent in 2010. Taxes and payments include taxes on earned income and capital income, municipal taxes, church taxes and sickness insurance contributions. In addition, EUR 4.1 billion were levied from wage and salary earners as employees’ employment pension and unemployment insurance contributions. Inclusive of mandatory insurance contributions, taxes and payments claimed, on average, 25.1 per cent of income.
Taxable income received by income earners amounted to EUR 120.8 billion. Of this, EUR 113.0 billion was earned income and EUR 7.8 billion was capital income. Earned income grew by 4.5 per cent and capital income by 13 per cent. In total, taxable income increased by five per cent. There were 4.5 million persons that received taxable income, this number increased by about one per cent.
Income earners received EUR 77 billion in wage and salary income in 2011, which was 4.5 per cent more than in 2010. Pension income increased by 4.8 per cent amounting to EUR 24.6 billion. Wage and salary income was received by 2.8 million persons and pension income by 1.6 million persons.
Dividends taxed as earned income and income from incentive options grew most among earned income. Dividends grew by 16 per cent and option income by 15 per cent. Income earners received EUR 407 million in dividends taxed as earned income and EUR 127 million in option income. By contrast, income earners received seven per cent less in daily unemployment allowances, three per cent less in student grants and one per cent less in child home care allowances than one year ago. Income earners received EUR 3.2 billion in daily unemployment allowances and other benefits based on unemployment security, EUR 515 million in student grants and EUR 381 million in child home care allowances.
Dividends taxed as capital income grew by 24 per cent. In all, income earners received EUR 1.6 billion in such dividends; EUR 770 million derived from listed companies, EUR 707 million from unlisted companies and EUR 104 million from foreign companies.
Income earners received EUR 3.8 billion from sale of property in 2011, which was 8.5 per cent more than in 2010. Income earners received EUR 1.3 billion in rent income, which was four per cent up on 2010. Capital income of forestry increased by 39 per cent amounting to EUR 663 billion. Other capital income, including benefits based on life insurance policies and other benefits included in capital income, grew clearly, by 46 per cent on 2010. Income earners received EUR 566 million in other capital income.
Income earners received EUR 1.0 billion in income from agriculture, EUR 3.0 billion from business activities and EUR 1.3 billion from groups. Income from agriculture grew by 2.7 per cent, from business activities by 5.8 per cent and entrepreneurial income from groups increased by 7.6 per cent.
Source: Taxable incomes 2011, Statistics Finland
Inquiries: Timo Matala 09 1734 3422, toimeentulo@stat.fi
Director in charge: Riitta Harala
Publication in pdf-format (186.8 kB)
- Tables
-
Tables in databases
Pick the data you need into tables, view the data as graphs, or download the data for your use.
Updated 19.12.2012
Official Statistics of Finland (OSF):
Taxable incomes [e-publication].
2011. Helsinki: Statistics Finland [referred: 19.4.2025].
Access method: http://stat.fi/til/tvt/2011/tvt_2011_2012-12-19_tie_001_en.html

