This set of statistics has been discontinued.
New data are no longer produced from the statistics.
Published: 19 December 2017
Direct taxes EUR 30.4 billion
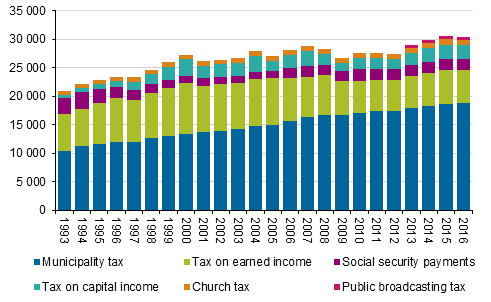
Income earners paid in total EUR 30.4 billion in direct taxes and payments in 2016, which was in nominal terms as much as one year earlier. The amount of municipal tax grew by 0.8 per cent, but the amount of income tax diminished by 0.5 per cent and the amount of capital tax by 5.1 per cent from the previous year. Municipal taxes accounted for the largest share, EUR 18.8 billion. Of taxes, state income tax amounted to EUR 8.2 billion, of which taxes on earned income were EUR 5.8 billion and taxes on capital income EUR 2.4 billion. Income earners paid EUR 1.3 billion in healthcare contributions, EUR 706 million in earned-income contribution payments and EUR 485 million in public broadcasting tax.
Direct taxes by type of tax in 1993 to 2016, EUR million at 2016 prices

Direct taxes have increased by 45 per cent in real terms from 1993 to 2016. During the same period, municipal tax has grown by 80 per cent and its share of direct taxes has increased from 50 to 62 per cent. The share of taxes on earned income in taxes diminished during this period from 31 to 19 per cent. In real terms, income earners paid nine per cent less in such taxes in 2016 than in 1993. In 2016, taxes on capital income accounted for 7.9 per cent of taxes, sickness insurance contributions for 6.5 per cent and the public broadcasting tax for 1.6 per cent.
Income earners received EUR 137.7 billion in taxable income, which was 1.5 per cent more than in the year before. Earned income made up EUR 126.9 billion of income and capital income EUR 8.8 billion. Earned income grew by 1.8 per cent from the year before, while capital income decreased by 4.0 per cent. The total number of income earners was 4.7 million, of whom 4.6 million received earned income and 2.6 million capital income.
Of earned income, two thirds were wages and salaries and one quarter pensions. In total, 2.8 million persons received EUR 83.2 billion in earned income and 1.6 million persons EUR 30.0 billion in pension income. From the previous year, wages and salaries grew by 1.7 per cent and pensions by 2.6 per cent. Of other earned income, income earners received a total of EUR 5.1 billion in daily unemployment allowances and other benefits based on unemployment security, EUR 1.3 billion in sickness insurance allowances, EUR 356 million in child home care allowance, and EUR 536 million in student grants. The amount of unemployment allowances went down by 1.3 per cent from the previous year. The amount of student grants grew by one per cent, but that of sickness insurance allowances diminished by five per cent and child home care allowances by 4.4 per cent.
Most of capital income, 39 per cent, were transfer gains. Transfer gains totalling EUR 3.5 billion were received by 342,000 persons. Transfer gains from securities diminished by 42 per cent from the previous year, transfer gains from other property, in turn, grew by 10 per cent. In all, 309,000 persons received rental income to the tune of EUR 1.6 billion, which was five per cent more than in the previous year. Income earners received EUR 726 million in capital income from forestry, 5.7 per cent more than in the year before.
Income earners received EUR 3.7 billion gross in dividends taxed as capital income, which was 8.9 per cent more than one year earlier. In total, 858,000 persons received dividend income. Taxable capital income from dividends amounted to EUR 2.0 billion, of which EUR 988 million came from listed, EUR 828 million from unlisted and EUR 229 million from foreign shares. Dividends from listed companies grew by 17.9 per cent, from unlisted ones by 3.3 per cent and from foreign shares by 13.2 per cent.
Income earners paid 22.4 per cent of their taxable income in taxes and taxable payments. In the previous year, income earners paid slightly more taxes, 22.7 per cent, on average. Taxes and payments here include taxes on earned income and capital income, municipal taxes, church taxes, sickness insurance contributions and public broadcasting tax. Wage or salary earners’ mandatory pension contributions inclusive of taxes and payments claimed, on average, 26.5 per cent of income.
Source: Taxable incomes 2016, Statistics Finland
Inquiries: Timo Matala 029 551 3422, toimeentulo@stat.fi
Director in charge: Jari Tarkoma
Publication in pdf-format (163.6 kB)
- Tables
-
Tables in databases
Pick the data you need into tables, view the data as graphs, or download the data for your use.
Updated 19.12.2017
Official Statistics of Finland (OSF):
Taxable incomes [e-publication].
2016. Helsinki: Statistics Finland [referred: 19.4.2025].
Access method: http://stat.fi/til/tvt/2016/tvt_2016_2017-12-19_tie_001_en.html

