Published: 6 November 2014
Placement of new employed persons in occupations 2012
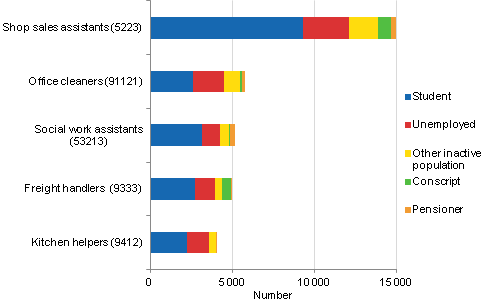
According to Statistics Finland's employment statistics, around 196,600 new employed persons entered the labour market in 2012. Most of the employed were students (around 90,100 persons 1) ). Of unemployed persons, around 63,200 persons found employment. The most common occupational groups for new employed persons were shop sales assistants (around 15,000 persons), office cleaners and social work assistants. Altogether, the number of new employed persons was around 24,900 lower in 2012 than in 2011.
Most common occupational groups of new employed persons in 2012 by principal activity in the year before

Here examined are those employed persons in 2012 who were not employed in the previous year according to Statistics Finland's employment statistics.
The most common occupational groups vary by gender and age among newly employed persons. Only among young newly employed persons aged 18 to 29, both men and women had the same most common occupational group, that is, shop sales assistants. (Appendix table 1.)
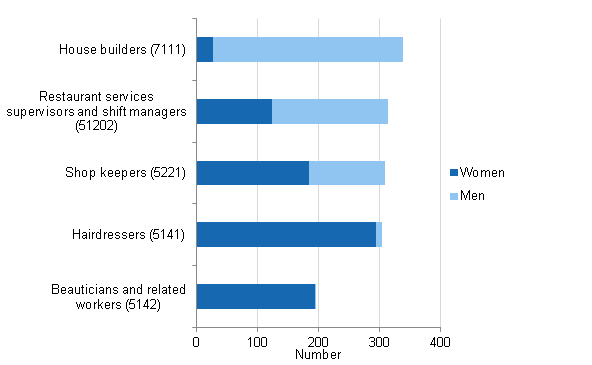
Of new employed persons, 4.3 per cent, or around 8,500 persons were entrepreneurs. Men's share was slightly higher than that of women, 54 per cent. The most typical occupational groups of new entrepreneurs were house builders, restaurant services supervisors and shift managers, shop keepers, and hairdressers (around 300 persons in each group). (Appendix table 2.)
Most common occupational groups of new entrepreneurs in 2012

The number of jobs has been growing from 2007 to 2012 2) in such industries as residential care activities and social work activities without accommodation, as well as food and beverage service activities 3) . The most common occupational groups of employed persons in these industries were social work assistants, hospital and institutional helpers, childminders in kindergartens and other institutions, household service workers, kitchen helpers, and food service counter attendants. (Appendix table 3.)
Of all occupational groups, the share of new employed persons was the largest, over 45 per cent, in the occupational groups of crop farm labourers, forestry labourers and garden and horticultural labourers. Around 400 new employed persons were working as crop farm labourers, for example.
In Statistics Finland's employment statistics for 2012, the occupations of wage and salary earners and entrepreneurs aged 18 to 74 according to their main employment relationship in the last week of the year have been classified into occupational groups according to the Classification of Occupations 2010 4) .
Links
Most common occupational groups of new sysselsatta aged 18 to 74 by region in 2012
1) Part of the students started as entrepreneurs (2,300 persons, i.e. 2.6 per cent).
2) Official Statistics of Finland (OSF): Employment [e-publication]. ISSN=2323-6825. Industry, Employer Sector and Jobs 2012. Helsinki: Statistics Finland [referred: 06.11.2014]. Access method: http://tilastokeskus.fi/til/tyokay/2012/03/tyokay_2012_03_2014-10-10_tie_001_en.html.
3) 2-digit industries according to the Standard Industrial Classification TOL 2008 with most growth in the number of jobs from 2007 to 2012 (see industries 87, 88 and 56) .
4) The data on occupations remained unknown for 3.1 per cent of all employed persons and for 11.5 per cent of all new employed persons.
Source: Employment Statistics, Statistics Finland
Inquiries: Elina Mikkelä 029 551 2973, Marketta Oinonen 029 551 3602, tyossakaynti@stat.fi
Director in charge: Riitta Harala
Publication in pdf-format (351.5 kB)
- Tables
-
Tables in databases
Pick the data you need into tables, view the data as graphs, or download the data for your use.
Appendix tables
- Appendix table 1. Most common occupational groups of new employed persons aged 18 to 74 by gender and age in 2012 1) (6.11.2014)
- Appendix table 2. Most common occupational groups of new entrepreneurs aged 18 to 74 by gender and age in 2012 1) (6.11.2014)
- Appendix table 3. Most common occupational groups of new employed persons aged 18 to 74 in industries with most growth in 2012 1) (6.11.2014)
Updated 06.11.2014
Official Statistics of Finland (OSF):
Employment [e-publication].
ISSN=2323-6825. Industry, employer sector and jobs 2012. Helsinki: Statistics Finland [referred: 20.4.2025].
Access method: http://stat.fi/til/tyokay/2012/04/tyokay_2012_04_2014-11-06_tie_001_en.html

