Published: 17 February 2017
A total of 88,000 unemployed found employment in 2015
According to Statistics Finland's employment statistics, there were 2,231,000 employed persons and 375,000 unemployed persons aged 18 to 64 at the end of 2015. In all, 88,000 of unemployed persons in 2014 found employment in 2015, and 3,300 of them became employed as self-employed persons. The economic dependency ratio weakened by two people from the previous year; in 2015, there were 143 non-employed persons per one hundred employed persons.
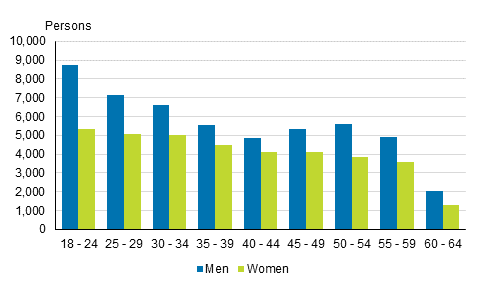
Unemployed persons having found employment in 2015 by age and gender

Of unemployed persons in 2014, 88,000 found employment in the course of the year
Of unemployed persons in 2014, around 24 per cent found employment during 2015: 88,000 persons (Appendix table 1). In all, 14,000 persons aged 18 to 24 found employment in 2015. In older age groups finding employment was lower: for example, around 13 per cent of persons aged 55 to 64 became employed.
There were no great differences between the genders in the share of persons having found employment: for women, the share was 24.3 per cent and for men, just 0.2 percentage points lower.
Finding work as self-employed was low for unemployed persons aged under 25
In 2015, there were 232,000 self-employed persons aged 18 to 64, of whom around 3,300 were unemployed in 2014. In absolute numbers, there were more persons getting employed as self-employed than in the previous year, but the share of persons becoming employed as self-employed fell, because 3.7 per cent of unemployed persons having found employment in 2015 became self-employed and in the previous year 4.1 per cent of unemployed persons became employed as self-employed.
Persons aged 35 to 49 became self-employed most often (around 5 % of persons having found employment). In older age groups it was rarer to move from unemployment to self-employment: Among persons aged 50 or over, 3.9 per cent became employed as self-employed in 2015.
Share of persons aged 18 to 64 having found employment as self-employed among all persons having found employment in 2015 by age, %
| Age | All persons having found employment, number 1) |
Persons having found employment as self-employed, number 1) |
Share of those having found employment as self-employed, % |
| 18 - 24 | 14,073 | 176 | 1.3 |
| 25 - 29 | 12,215 | 379 | 3.1 |
| 30 - 34 | 11,617 | 511 | 4.4 |
| 35 - 39 | 10,040 | 504 | 5.0 |
| 40 - 44 | 8,964 | 436 | 4.9 |
| 45 - 49 | 9,455 | 465 | 4.9 |
| 50 - 54 | 9,452 | 429 | 4.5 |
| 55 - 59 | 8,502 | 316 | 3.7 |
| 60 - 64 | 3,344 | 95 | 2.8 |
It was also rare for unemployed young people to become self-employed: 1.3 per cent of unemployed persons aged 18 to 24 got employed as self-employed and just 2.1 per cent of persons aged under 30 having become employed were employed as self-employed. In 2015, around 17,300 persons aged under 30 worked as self-employed: 7.4 per cent of all self-employed persons. Of employed persons aged under 30, the majority were wage and salary earners, because only 3.9 per cent of them were self-employed.
Around 15,000 wage and salary earners became self-employed
In 2015, around 15,000 wage and salary earners, 2,000 students, 430 pensioners and 2,700 persons from the group of other persons outside the labour force aged 18 to 64 turned self-employed. Among the unemployed, wage and salary earners and those in the other persons outside the labour force group persons aged 30 to 34 turned self-employed most (Appendix table 2).
Transitions from different main type of activity categories to self-employment between 2014 and 2015
| Main type of activity year 2014 | Number of employed persons as self–employed aged 18 to 64 in 2015 |
| Wage and salary earners | 14,863 |
| Unemployed | 3,311 |
| Students, pupils | 2,029 |
| Pensioners | 427 |
| Other persons outside the labour force | 2,704 |
| Total | 23,402 |
In 2015, around 5,500 persons aged under 30 turned self-employed. Around 3,000 of them were wage and salary earners, 1,200 students, 560 unemployed and 520 belonged to other persons outside the labour force by main type of activity.
Source: Employment Statistics, Statistics Finland
Inquiries: Netta Hiitola 029 551 3552, info@stat.fi
Director in charge: Jari Tarkoma
Publication in pdf-format (243.4 kB)
- Reviews
-
- 1. Economic dependency ratio was 143 in 2015 (17.2.2017)
- Tables
-
Tables in databases
Pick the data you need into tables, view the data as graphs, or download the data for your use.
Appendix tables
Updated 17.2.2017
Official Statistics of Finland (OSF):
Employment [e-publication].
ISSN=2323-6825. Background information on unemployed persons 2015. Helsinki: Statistics Finland [referred: 20.4.2025].
Access method: http://stat.fi/til/tyokay/2015/03/tyokay_2015_03_2017-02-17_tie_001_en.html

