Published: 25 May 2018
Average number of unemployment days accumulated over a five-year period 801 for the unemployed at the end of 2017
According to Statistics Finland’s employment statistics, there were 296,000 unemployed persons at the end of 2017. On average, unemployed persons had accumulated over two years’ worth of unemployment days over a five-year period. On average, older unemployed persons had accumulated more unemployment days than younger ones and men more than women. Roughly every third unemployed person had been continuously unemployed for at least a year. The data on unemployment in the employment statistics are based on the data of the Register of Job Seekers of the Ministry of Economic Affairs and Employment.
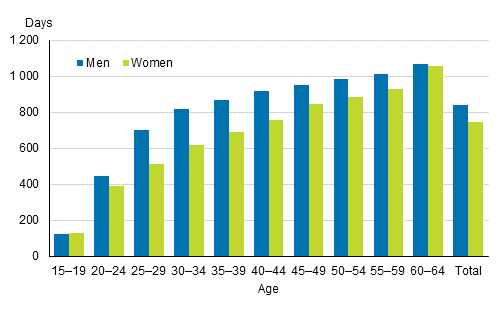
Average number of unemployment days of unemployed persons in a five-year period by age and sex

Persons that were unemployed at the end of 2017 had in the past five years (2013 to 2017) been unemployed for an average of 801 days. So over a five-year period, unemployed persons had accumulated, on average, over two years' worth of unemployment days. Unemployment days refer to days when a person has been an unemployed job seeker. Unemployment days could have accumulated during several different unemployment periods.
The average amount of unemployment days accumulated over a five-year period was higher the older the person in question was. Those belonging to the oldest age group had been unemployed for an average of 1,065 days or in other words, for nearly three years in the past five years.
Men who were unemployed at the end of 2017 had been unemployed in the past five years for an average of 843 days and women for 748 days. The difference between the sexes was smallest among the youngest (aged 15 to 19) and oldest (aged 60 to 64) age groups. The difference was biggest among those aged 30 to 34: for men 822 days and for women 617 days.
Almost the same number of unemployment days for completers of upper secondary and doctorate level education
Over the five year period, the fewest unemployment days, on average, had been accumulated for those with specialist vocational qualifications (653 days) and the second fewest for those with lower university level degrees (708 days), when examining the person's highest degree or qualification in 2016. Those with lowest level tertiary qualifications (893 days), doctorate level degrees (865 days) and upper secondary qualifications (829 days) had the most unemployment days. So according to this examination, higher education would not seem to affect the duration of unemployment.
43,000 persons unemployed for four years or more
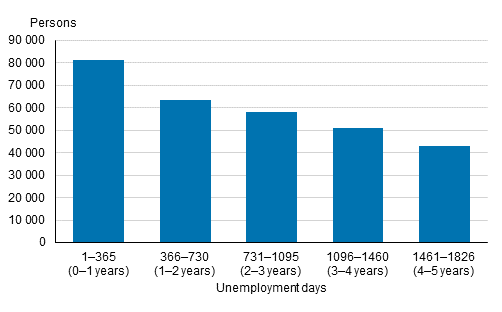
Good one-quarter (81,000 persons) of those who had been unemployed at the end of 2017 had in the past five years been unemployed in total for one year or less. Nearly 43,000 persons or 14 per cent of those who were unemployed at the end of 2017 had been unemployed in total for four years or longer (1,461 to 1,826 days). In all, 7,305 persons had been unemployed for the entire reference period or 1,826 days. The vast majority of them (64 %) were men. Of those who had been unemployed for the entire five-year period, 61 per cent were aged 55 to 64.
Number of unemployed persons by unemployment day group

One-third of the unemployed were long-term unemployed
One-third (91,000) of those who were unemployed at the end of 2017 had been continuously unemployed for at least one year, i.e. they were long-term unemployed. One-half (46,800) of the long-term unemployed had been continuously unemployed for more than two years. A majority of the unemployed persons had, however, been unemployed for a shorter period: Forty per cent have been continuously unemployed for less than a hundred days.
In Mainland Finland, the share of long-term unemployed among all unemployed persons was lowest in South Ostrobothnia (18%) and in Kainuu (23%). The share was highest in Päijät-Häme (36%) and Uusimaa (34%).
Source: Employment Statistics, Statistics Finland
Inquiries: Elina Pelkonen 029 551 3022, Netta Hiitola 029 551 3552, info@stat.fi
Director in charge: Jari Tarkoma
Publication in pdf-format (228.2 kB)
- Tables
-
Tables in databases
Pick the data you need into tables, view the data as graphs, or download the data for your use.
Appendix tables
- Appendix table 1. The average number of unemployment days accumulated over a five-year period (2013 to 2017) for persons who were unemployed at the end of 2017 by age group and sex (25.5.2018)
- Appendix table 2. The average number of unemployment days accumulated over a five-year period (2013 to 2017) for persons who were unemployed at the end of 2017 by level of education (25.5.2018)
- Appendix table 3. The number of unemployment days accumulated over a five-year period (2013 to 2017) for persons who were unemployed at the end of 2017 by unemployment day group (25.5.2018)
- Appendix table 4. The average number of unemployment days accumulated over a five-year period (2013 to 2017) for persons who were unemployed at the end of 2017 by region (25.5.2018)
- Appendix table 5. Number of persons who were unemployed at the end of 2017 and the share of long-term unemployed by region (25.5.2018)
Updated 25.5.2018
Official Statistics of Finland (OSF):
Employment [e-publication].
ISSN=2323-6825. Main type of activity and status in occupation 2017. Helsinki: Statistics Finland [referred: 20.4.2025].
Access method: http://stat.fi/til/tyokay/2017/02/tyokay_2017_02_2018-05-25_tie_001_en.html

