1. Economic dependency ratio was 132 in 2018
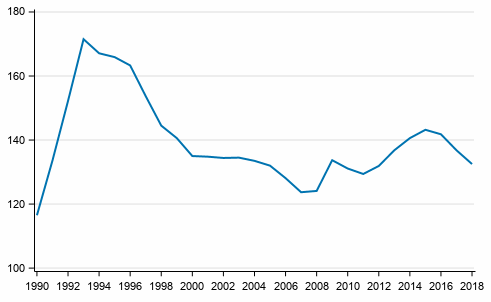
According to the data of Statistics Finland's employment statistics, the economic dependency ratio was 132 in 2018. This means that there were 132 non-employed persons per one hundred employed persons in 2018. In 2017, the dependency ratio was 137. In total, there were 2,348,000 employed persons aged 18 to 64 in 2018 of which 2,111,000 were wage and salary earners and 236,000 self-employed persons. There were 256,000 unemployed persons and 2,888,000 persons in the inactive population.
Economic dependency ratio in 1990 to 2018

The economic dependency ratio refers to the ratio of the number of employed persons to unemployed persons and persons in the inactive population. The inactive population includes persons aged 0 to 14, students and pupils, conscripts and those in non-military service, pensioners and others in the inactive population.
When the number of employed rises relative to the number of unemployed and persons in the inactive population, the economic dependency ratio falls. Correspondingly, when the number of unemployed and persons in the inactive population grows relative to the number of employed, the economic dependency ratio grows. The variation of the economic dependency ratio may be influenced by the growing number of pensioners and the employment situation. There has been great variation in the economic dependency ratio in the past few decades. During the recession in the 1990s, the economic dependency ratio was high. It was at its highest in 1993, when there were 172 non-employed persons per one hundred employed persons. The economic dependency ratio was at its lowest in 1989 (112).
1.1 Number of employed in the population was 2,374,000 and that of persons in the inactive population was 3,144,000
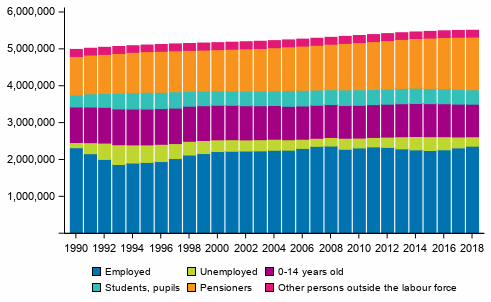
In 2018, a total of 256,000 persons were unemployed. The number of unemployed fell by 40,000 from the year before. Of those in the inactive population, 1,430,000 were pensioners, 391,000 students and pupils, 882,000 were aged 0 to 14, and 7,800 were conscripts and in the non-military service.
According to the employment statistics, the share of unemployed persons aged 18 to 64 in the labour force was 9.8 per cent in 2018. From the previous year, the share fell by 1.6 percentage points. The share of unemployed was 8.7 per cent for women and 11 per cent for men.
Population by main type of activity in 1990 to 2018

The weakening of the economic dependency ratio is influenced by the share of unemployed persons as well as by the ageing of the population and thus, by the number of pensioners. In 2018, Finland had 1,430,000 pensioners. In 2017, the number of pensioners was 1,415,000. The number of pensioners grew by 15,000 persons in a year.
1.2 Economic dependency ratios lowest in the regions of ┼land, Uusimaa and Ostrobothnia
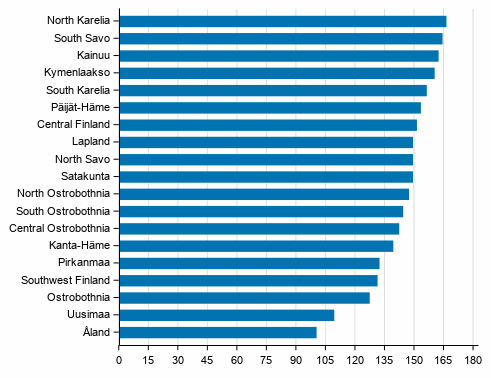
In the comparison between regions, the economic dependency ratio was lowest in ┼land in 2018. In the region, there were 100 unemployed and persons in the inactive population per one hundred employed persons. In ┼land, there were 14,900 employed and 550 unemployed persons. On the regional level, the economic dependency ratio was also low in the region of Uusimaa, where the economic dependency ratio was 109 and in Ostrobothnia, where it was 127. The economic dependency ratios in 2018 were highest in the following regions: North Karelia (166), South Savo (164) and Kainuu (162). In North Karelia, there were 61,100 employed and 9,900 unemployed persons. In 2018, the share of unemployed in the labour force was highest in North Karelia (14 %) and lowest in ┼land (3.6 %).
Economic dependency ratio by region in 2018

1.3 Share of pensioners largest in the region of South Savo
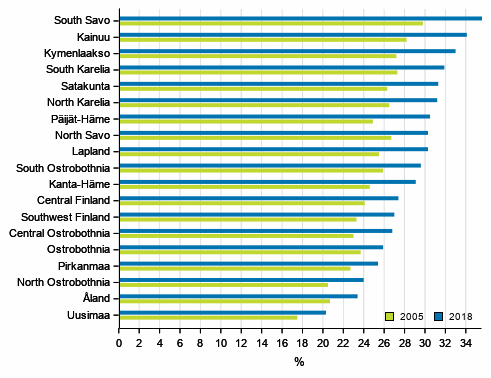
The growing number of pensioners is visible in all regions. There is great variation in the share of pensioners between the regions. In 2018, the share of pensioners in the population of the region was highest in the region of South Savo (35.6 %) and lowest in the region of Uusimaa (20.2 %). The number of pensioners was 52,000 in South Savo and 337,000 in Uusimaa in 2018.
Share of pensioners by region in 2005 and 2018

Source: Employment Statistics, Statistics Finland
Inquiries: Elina Pelkonen 029 551 3011, info@stat.fi
Director in charge: Jari Tarkoma
Updated 17.04.2020
Official Statistics of Finland (OSF):
Employment [e-publication].
ISSN=2323-6825. profession and socio economic position 2018,
1. Economic dependency ratio was 132 in 2018
. Helsinki: Statistics Finland [referred: 20.4.2025].
Access method: http://stat.fi/til/tyokay/2018/01/tyokay_2018_01_2020-04-17_kat_001_en.html

