2. Professional differentiation among wage and salary earners and entrepreneurs in 2019 and 2014
The share of wage and salary earners working in equal occupations among all wage and salary earners was ten per cent in 2019, unchanged from 2014. The share of entrepreneurs working in equal occupations was 16 per cent in 2019, an increase of 3 percentage points from 2014.
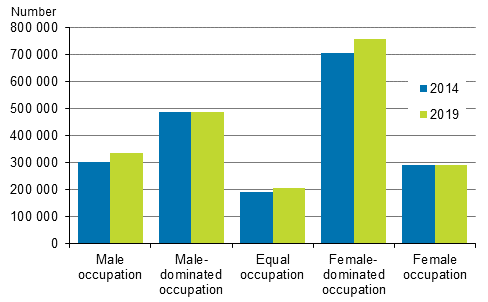
Figure 1. Number of wage and salary earners in various segregation classes in 2014 and 2019

Professional differentiation by sex, segregation, is based on the classification of occupational groups by gender proportions. The strength of the segregation is determined based on how many persons work in equal occupational groups.
Table 1. 5-class segregation classification of occupations
| Segregation class | The occupational groups in which |
| Female occupation | women > 90 % |
| Female-dominated occupation | 60 % < share of women <= 90 % |
| Equal occupation | 40 % <= share of women / men <=60 % |
| Male-dominated occupation | 60 % < share of men <= 90 % |
| Male occupation | men > 90 % |
Occupational segregation among wage and salary earners and entrepreneurs is examined in the following sections based on the 5-digit level of the Classification of Occupations 2010.
2.1 Share of wage and salary earners working in equal occupations equal to five years earlierIn 2019, 9.9 per cent of all wage and salary earners were in so-called equal occupational groups, where the share of different sexes among those included in the occupational group is 40 to 60 per cent.. The share was almost the same as five years earlier. The share of wage and salary earners working in equal occupations among all wage and salary earners (excl. occupational data missing) was 9.8 % in 2014..
For wage and salary earners, the most evenly divided occupational groups in 2019 were restaurant managers (300 persons in total of whom 50.3 per cent women and 49.7 per cent men), building architects (3,600 persons in total of whom 49.5 per cent women and 50.5 per cent men), and head teachers (universities of applied sciences) (700 persons in total of whom 49.4 per cent women and 50.6 per cent men).
In 2019, wage and salary earners’ most common equal occupational groups were advertising and marketing professionals (17,100 persons), food and related products machine operators (14,400 persons) and vocational education teachers (12,600 persons).
Table 2. Wage and salary earners aged 18 to 74 in segregation classes in 2019 1)
| Correction on 26 October 2022. The corrections are indicated in red. | ||||||
| Segregation class | Wage and salary earners | Share of wage and salary earners, % | Women | Share of women, % | Men | Share of men, % |
| Female occupations | 289,815 | 14.0 | 270,746 | 25.2 | 19,069 | 1.9 |
| Female-dominated occupations | 756,304 | 36.5 | 571,078 | 53.1 | 185,226 | 18.5 |
| Equal occupations | 205,254 | 9.9 | 103,755 | 9.7 | 101,499 | 10.2 |
| Male-dominated occupations | 489,341 | 23.6 | 112,385 | 10.5 | 376,956 | 37.7 |
| Male occupations | 333,938 | 16.1 | 17,062 | 1.6 | 316,876 | 31.7 |
| Total | 2,074,652 | 100 | 1,075,026 | 100 | 999,626 | 100 |
2.2 Share of entrepreneurs working in equal occupations among all entrepreneurs has grown
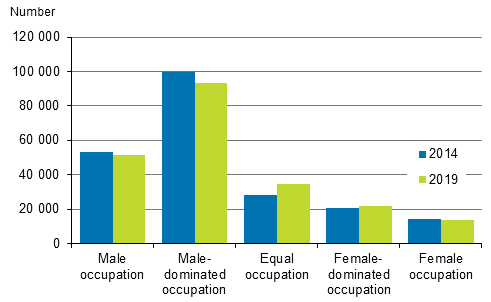
In 2019, a total of 16.2 per cent of all entrepreneurs were in equal occupations, where the share of different sexes among those included in the occupational groups is 40 to 60 per cent. The share of entrepreneurs working in equal occupations among all entrepreneurs in 2019 (excl. occupational data missing) increased by 3.3 percentage points from 2014.
The examination disregards the fact that women's share of all entrepreneurs was only 34 per cent.
Figure 2. Number of entrepreneurs in various segregation classes in 2014 and 2019

For entrepreneurs, the most evenly divided occupational groups were journalists (in total around 90 persons, of whom 50.6 per cent were women and 49.4 per cent men), sociologists, anthropologists and related professionals (in total around 60 persons, of whom 50.8 per cent are women and 49.2 per cent men) and domestic housekeepers (a total of 540 persons, of whom 49.0 per cent were women and 51.0 per cent men).
In 2019, the most common equal occupational groups of entrepreneurs were shop keepers (small entrepreneurs) (8,400 persons), mixed crop and animal producers (4,900 persons) and restaurant services supervisors and shift managers (4,400 persons).
Table 3. Entrepreneurs aged 18 to 74 in segregation classes in 2019 1)
| Correction on 26 October 2022. The corrections are indicated in red. | ||||||
| Segregation class | Entrepreneurs | Share of entrepreneurs, % | Women | Share of women, % | Men | Share of men, % |
| Female occupations | 13,515 | 6.3 | 12,514 | 18.0 | 1,001 | 0.7 |
| Female-dominated occupations | 21,498 | 10.0 | 14,965 | 21.5 | 6,533 | 4.5 |
| Equal occupations | 34,683 | 16.2 | 16,406 | 23.6 | 18,277 | 12.6 |
| Male-dominated occupations | 93,361 | 43.6 | 22,595 | 32.4 | 70,766 | 48.9 |
| Male occupations | 51,224 | 23.9 | 3,172 | 4.6 | 48,052 | 33.2 |
| Total | 214,281 | 100 | 69,652 | 100 | 144,629 | 100 |
Source: Employment Statistics, Statistics Finland
Inquiries: Juho Keva 029 551 3601, info@stat.fi
Head of Department in charge: Hannele Orjala
Updated 18.11.2021
Official Statistics of Finland (OSF):
Employment [e-publication].
ISSN=2323-6825. Industry, employer sector and jobs 2019,
2. Professional differentiation among wage and salary earners and entrepreneurs in 2019 and 2014
. Helsinki: Statistics Finland [referred: 20.4.2025].
Access method: http://stat.fi/til/tyokay/2019/04/tyokay_2019_04_2021-11-18_kat_002_en.html

