Published: 10 March 2022
Long-term unemployment grew in the corona year 2020
According to Statistics Finland's employment statistics, 91,100 persons had been unemployed continuously for over a year at the end of 2020. The number of long-term unemployed grew by 45 per cent compared to 2019. The number of long-term unemployed increased most in Uusimaa, North Ostrobothnia and Pirkanmaa. The proportion of long-term unemployed persons in the labour force was highest in North Karelia, Päijät-Häme and Central Finland. In relative terms, the growth in long-term unemployment was biggest among young people, those with a lower level of education and persons with qualifications in services.
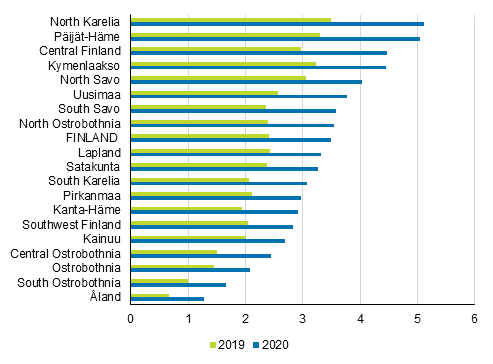
Proportion of long-term unemployed persons in the labour force (aged 18 to 64) by region in 2019 and 2020, %

At the end of 2020, the number of persons who had been unemployed continuously for over a year, or long-term unemployed, was 91,100, which was 28,200 (45%) more than at the end of 2019. 1) The number of long-term unemployed persons increased in all regions. The number of long-term unemployed grew most in Uusimaa (10,500), North Ostrobothnia (2,200) and Pirkanmaa (2,200). The relative growth of long-term unemployment was, in turn, largest in Åland and in South and Central Ostrobothnia. Other regions with the relative highest growth in the number of long-term unemployed were: Päijät-Häme, Kanta-Häme, South Savo, Central Finland and North Ostrobothnia.
The proportion of the long-term unemployed in the labour force (aged 18 to 64) was highest in North Karelia, Päijät-Häme and Central Finland, where it was around five per cent. The proportion of long-term unemployed was, in turn, lowest in Åland, South Ostrobothnia and Ostrobothnia, where it was around one to two per cent.
Examined by age group, the number of long-term unemployed grew most among the older age groups in 2020. The number of long-term unemployed aged 55 to 64 increased by 10,100, that of those aged 45 to 54 by 5,800, that of people aged 35 to 44 by 5,700, those aged 25 to 34 by 5,000, and those aged 18 to 24 by 1,700. The relative growth of long-term unemployment was biggest among people aged 18 to 24 (82%).
The number of long-term unemployed men grew by 16,700 (44%) and that of women by 11,600 (46%).
Growth in long-term unemployment affected those with a lower level of education and those with qualifications in services
Examined by level of education, the number of long-term unemployed grew in 2020 most among those whose highest qualification was an upper secondary level qualification. Among them, the number of long-term unemployed grew by 14,400, which was around 48 per cent more than in the year before. The number of long-term unemployed without a post-comprehensive school qualification or with unknown level of education grew by 8,000 (45%). The number of long-term unemployed with tertiary level or lowest level tertiary qualifications grew, in turn, by 5,900 (39%).
Relative change in the number of long-term unemloyed by field and level of education from 2019 to 2020, %

Examined by field of education, the number of long-term unemployed grew in 2020 most among those with qualifications in technology (6,400), business, administration and law (3,400), and services (2,900). The number of those with qualifications in services also grew in relative terms most, by 54 per cent in all. Examined by level and field of education, the growth of the long-term unemployed with upper secondary level qualifications was highest in social sciences and among those with tertiary level or lowest level tertiary qualifications in education. In all educational sub-groups except for education, the relative growth in the number of the long-term unemployed was higher for those with upper secondary level qualifications than for those with tertiary level qualifications.
1) For long-term unemployed persons, the number of consecutive days of unemployment exceeds 365.
Source: Employment Statistics, Statistics Finland
Inquiries: Meri Raijas 029 551 3061, Mikko Toiviainen 029 551 3589, info@stat.fi
Head of Department in charge: Hannele Orjala
Publication in pdf-format (266.6 kB)
- Reviews
-
- 1. Economic dependency ratio was 142 in 2020 (10.3.2022)
- Tables
-
Tables in databases
Pick the data you need into tables, view the data as graphs, or download the data for your use.
Appendix tables
Updated 10.3.2022
Official Statistics of Finland (OSF):
Employment [e-publication].
ISSN=2323-6825. profession and socio economic position 2020. Helsinki: Statistics Finland [referred: 18.4.2025].
Access method: http://stat.fi/til/tyokay/2020/01/tyokay_2020_01_2022-03-10_tie_001_en.html

