3 Working hours in 2010
3.1 Working hours change slowly
The concepts of working hours used in these statistics are usual weekly working hours, hours actually worked per week and hours actually worked per employed.
Usual weekly working hours refer to an employee's normal or average weekly working hours in the main job. Regular paid or unpaid overtime is included in the usual weekly working hours of employees. The average of usual weekly working hours is influenced by the form or working hours, i.e. whether full-time or part-time work is concerned.
Hours actually worked per week is the number of hours an employed person has worked in the survey week. Hours actually worked per week are separately inquired about in respect of main job and secondary job. Paid or unpaid overtime hours are also included in it. On the other hand, holidays, weekdays off and absences for other reasons (e.g. sickness) reduce the hours actually worked per week.
Hours actually worked per employed is a calculated concept, which is obtained by dividing the number of hours actually worked by all employed persons during the year by the annual average number of employed persons. This produces the average hours actually worked per an employed person. The average hours actually worked per employed is calculated in the same way for employed employees.
Working hours and hours worked fluctuate according to changes in employment and in the structure of the employee population. For instance, if part-time work becomes more widespread than full-time work, the average weekly working hours decrease. Working hours also vary by industry and occupation, as well as by employer sector. Working hours change quite slowly.
3.2 Commonest working week is 35 to 40 hours
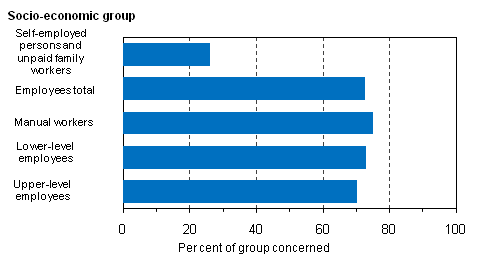
The vast majority (73%) of employees worked a usual week of 35 to 40 hours in 2010. Variations between different employee groups were fairly small. Only one in four of self-employed persons and assisting family members worked a usual week of 35 to 40 hours. (Figure 6.)
Figure 6. Share of persons working a usual week of 35 to 40 hours in the main job by socio-economic group in 2010, %
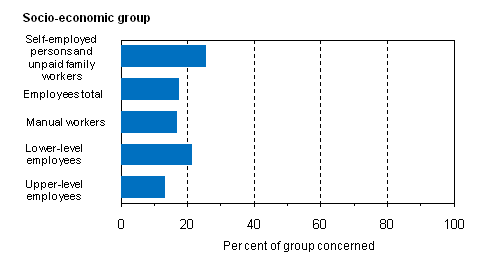
Approximately 18 per cent of employees had a short working week of under 35 hours. Around one in five of lower-level employees worked short hours. Short working weeks were less widespread among upper-level employees. Those with a usual short working week most typically worked 30 to 34 hours per week. One self-employed person and assisting family member in four did a short working week. (Figure 7.)
Figure 7. Share of persons working a short usual week of 1 to 34 hours in the main job by socio-economic group in 2010, %
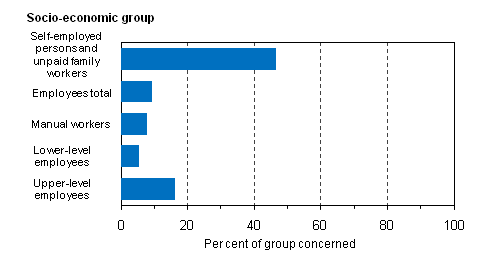
Approximately nine per cent of employees worked a long week of over 40 hours. Among all employees, upper-level employees most often worked usually long hours. Sixteen per cent of them had long weekly working hours. Long usual weekly working hours were most widespread among self-employed persons and assisting family members, of whom 47 per cent usually worked long hours. (Figure 8.)
Figure 8. Share of persons working a long usual week of over 40 hours in the main job by socio-economic group in 2010, %
3.3 Men’s working week in full-time employment longer than women’s
The average usual weekly working hours hardly changed between 2009 and 2010. In 2010, employees' average usual weekly working hours in the main job were 36.5 hours and their hours actually worked per week in the main job were 35.6 hours. The longest weekly hours were worked by self-employed persons and assisting family members whose average usual weekly working hours in the main job totalled 43.3 and hours actually worked per week 41.5 hours. Men’s usual weekly working hours and hours actually worked per week are longer than women’s (Table 1). Hours actually worked per week are reduced by holidays and other absences and increased by worked overtime hours.
Table 1. Average of employees’ usual weekly working hours and hours actually worked per week in the main job in full-time and part-time work in 2010
| Usual weekly working hours | Hours actually worked per week | |||
| Full-time work | Part-time work | Full-time work | Part-time work | |
| Total | 39.1 | 20.4 | 37.8 | 20.8 |
| Men | 40.0 | 19.5 | 38.9 | 19.9 |
| Women | 38.2 | 20.8 | 36.6 | 21.3 |
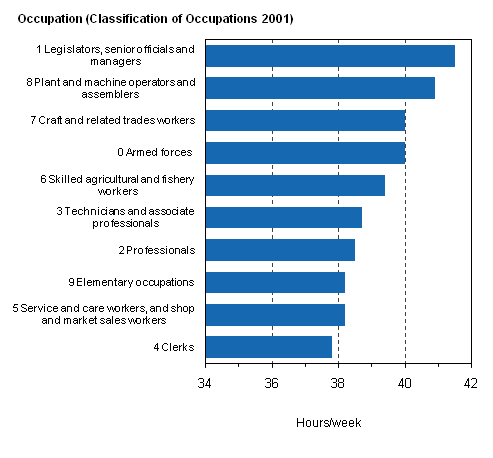
The average usual weekly working hours in the main job of managers and highest office holders in full-time work were around 41.5 hours (Figure 9). Apart from them, only process and transport workers did a long working week of over forty hours in their main job. Office and customer service workers did the shortest working week.
Figure 9. Average of employees’ usual weekly working hours in the main job in full-time work by occupation in 2010
3.4 Hours actually worked per employed increased slightly in 2010
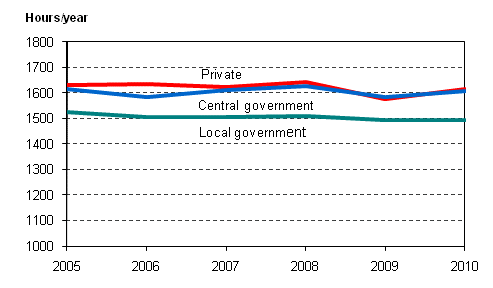
In the private sector and in central government, the hours actually worked per employed (see explanation of the concept above) have been almost equal in recent years. In the private sector, the hours actually worked per employed increased in 2010. This may partly be explained by reductions in temporary lay-offs and shortened working hours. In the central government sector, too, the hours actually worked per employed increased.
In the local government sector, the hours actually worked per employed are clearly below those in other sectors, and this has hardly changed at all. (Figure 10.)
Figure 10. Employees' hours actually worked per employed by employer sector in 2005-2010
In 2010, the number of hours actually worked per employed was 211 hours lower among female employees than among male employees. Both among men and women, the hours actually worked per employed increased slightly in 2010. Among men, the hours actually worked per employed went up by 29 hours and among women by 26 hours from 2009 to 2010.
The number of female employees' hours actually worked per employed is these days approximately 200 to 250 lower than male employees'. For instance, women work more often part-time than men. Two-thirds of all employees working part-time are women. Family leaves also shorten women’s hours actually worked more than men’s.
3.5 Sunday work increased in the trade industry in 2010
Saturday and Sunday work and shift work represent working hours that deviate from the usual daywork that is done on weekdays. Around 17 per cent of the employed and 14 per cent of employees did Saturday work in the main job during the survey week in 2010. Approximately 12 per cent of employed persons and 10 per cent of employees did Sunday work during the survey week. (Table 2.)
The opening hours were extended in retail trade as of 1 December 2009. This shows as an increase in Sunday work in the trade industry. In 2010, Sunday work in the main job was done in the survey week by 28,000 employees in the wholesale and retail trade, which is 8,000 more than in the year before. When looking at the total for all industries, the share of employees doing Sunday work did not change from 2009 to 2010.
In 2010, around one in four of female employees and one in five of men did shift work.
Table 2. Share of employed persons and employees having done shift work in the main job, and week-end work during the survey week in the main job by sex in 2010, %
| Employed persons | Employees | ||||
| Saturday work | Sunday work | Saturday work | Sunday work | Shift work | |
| Total | 17 | 12 | 14 | 10 | 23 |
| Men | 17 | 12 | 12 | 8 | 19 |
| Women | 18 | 12 | 16 | 11 | 26 |
Source: Labour force survey 2010. Statistics Finland
Inquiries: Heidi Melasniemi-Uutela (09) 1734 2523, Olga Kambur (09) 1734 3565, tyovoimatutkimus@stat.fi
Director in charge: Riitta Harala
Updated 7.6.2011
Official Statistics of Finland (OSF):
Labour force survey [e-publication].
ISSN=1798-7857. 15 2010,
3 Working hours in 2010
. Helsinki: Statistics Finland [referred: 16.4.2025].
Access method: http://stat.fi/til/tyti/2010/15/tyti_2010_15_2011-06-07_kat_003_en.html

