2 Unemployment decreased in 2011
There were 16,000 fewer unemployed persons in 2011 than in the year before. The average number of unemployed persons was 209,000. There were 117,000 unemployed men and 91,000 unemployed women. Compared to 2010, there were 9,000 fewer unemployed men and 7,000 fewer unemployed women. The number of unemployed persons decreased in each quarter of the year from the respective quarter of the previous year.
The average rate of unemployment was 7.8 per cent in 2011, having been 8.4 per cent in 2010. Men’s unemployment rate was 8.4 per cent and women’s 7.1 per cent.
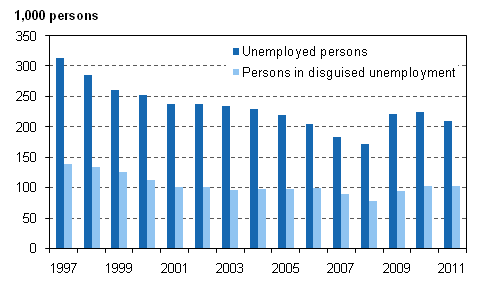
Persons in disguised unemployment are economically inactive persons who would like to be gainfully employed but do not actively look for work for diverse reasons. In 2011, there were 103,000 persons in disguised unemployment, which is almost the same number as in 2010. The numbers of persons in disguised unemployment were the highest in the 15 to 24 age group (33,000) and the 55 to 64 age group (26,000). The combined total number of unemployed persons and persons in disguised unemployment was 312,000 in 2011 (Figure 6).
Figure 6. Unemployed persons and persons in disguised unemployment in 1997–2011, persons aged 15 to 74

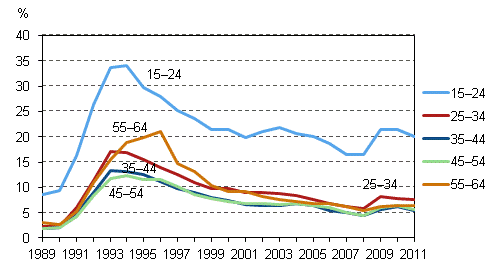
In 2011, the rate of unemployment among the population aged 15 to 24 was 20.1 per cent. The rate of unemployment among young people was 1.3 percentage points lower than in the previous year. In other age groups, rates of unemployment fell only fractionally (Figure 7). Around one-third of all unemployed persons were aged under 25. There were 65,000 unemployed persons aged 15 to 24.
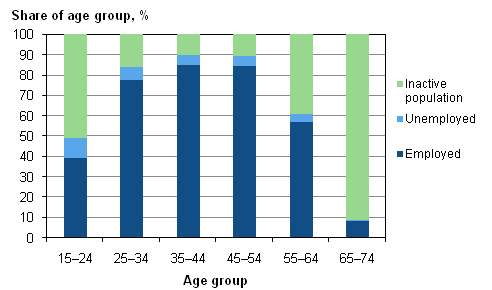
The shares of the unemployed of the total age group were in 2011 almost on level with 2010. Approximately 10 per cent of the 15 to 24 age group were unemployed in 2011 (Figure 8).
Figure 7. Unemployment rates by age group in 1989–2011, %

Figure 8. Shares of employed and unemployed persons, and inactive population of age group in 2011, %

The average number of temporarily laid-off persons was 12,000 in 2011 whereas in the previous year it was 21,000. The number of laid-off persons decreased in every quarter compared to the quarters of 2010 (Table 1).
Table 1. Temporarily laid-off persons aged 15–74 by quarter in 2009–2011
| Year | |||
| 2009 | 2010 | 2011 | |
| Quarter | Persons | Persons | Persons |
| I | 38,000 | 35,000 | 18,000 |
| II | 42,000 | 19,000 | 11,000 |
| III | 31,000 | 15,000 | 9,000 |
| IV | 36,000 | 14,000 | 11,000 |
| Annual mean | 37,000 | 21,000 | 12,000 |
In 2011, 22 per cent of the temporarily laid-off persons were defined as unemployed, 33 per cent as employed and 44 per cent as belonging to the inactive population.
Source: Labour Force Survey 2011. Statistics Finland
Inquiries: Kirsi Toivonen 09 1734 3535, Olga Kambur 09 1734 3565, Tarja Nieminen 09 1734 3561, tyovoimatutkimus@stat.fi
Director in charge: Riitta Harala
Updated 9.3.2012
Official Statistics of Finland (OSF):
Labour force survey [e-publication].
ISSN=1798-7857. Employment and unemployment in 2011 2011,
2 Unemployment decreased in 2011
. Helsinki: Statistics Finland [referred: 19.4.2025].
Access method: http://stat.fi/til/tyti/2011/13/tyti_2011_13_2012-03-09_kat_002_en.html

