2 Not much change in unemployment in 2012
No appreciable changes took place in unemployment between 2011 and 2012. In 2012, the average number of unemployed persons was 207,000. The number of unemployed men was 115,000 and that of women 92,000. The numbers of unemployed men and women remained almost on level with the previous year. The number of unemployed went down in the first two quarters, but grew in the third and fourth quarters when compared to 2011.
The rate of unemployment was, on average, 7.7 per cent in 2012, having been 7.8 per cent in 2011. Men’s unemployment rate was 8.3 per cent and women’s 7.1 per cent.
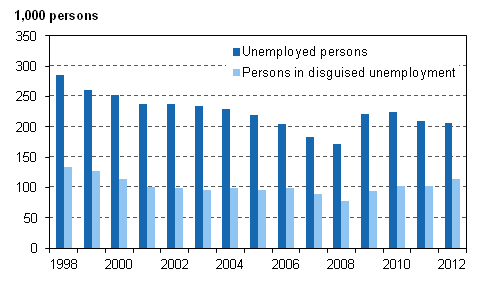
In 2012, besides unemployed persons there were 113,000 persons outside the labour force in so-called disguised unemployment, who would and could have accepted work, but had not looked for it actively. The number of persons in disguised unemployment grew by 10,000 from 2011. The numbers of persons in disguised unemployment were the highest in the 15 to 24 age group (35,000) and in the 55 to 64 age group (27,000). The combined total number of unemployed persons and persons in disguised unemployment was 320,000 in 2012 (Figure 6).
Figure 6. Unemployed persons and persons in disguised unemployment in 1998–2012, persons aged 15 to 74

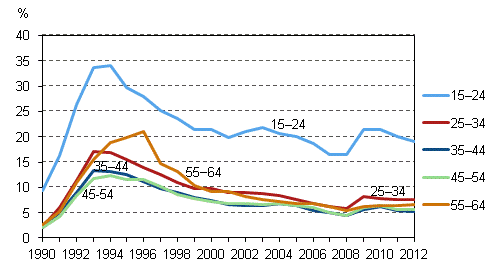
The rate of unemployment, that is, the proportion of unemployed in the labour force, among young people aged 15 to 24 was 19.0 per cent in 2012. The proportion was 1.1 percentage points lower than in the previous year. In other age groups, rates of unemployment remained more or less unchanged (Figure 7). In the 15 to 24 age group, 63,000 were unemployed, being nearly one-third of all unemployed persons.
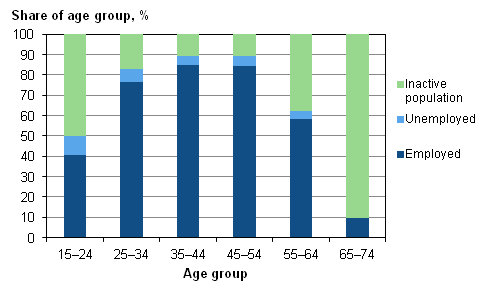
When examining the share of unemployed persons in the whole age group, around ten per cent of the 15 to 24 age group were unemployed (Figure 8). The shares of unemployed persons in the whole age group stayed in 2012 almost on level with 2011.
Figure 7. Unemployment rates by age group in 1990–2012, %

Figure 8. Shares of employed and unemployed persons, and inactive population of age group in 2012, %

There were an average of 12,000 temporarily laid-off persons in 2012, which was on level with the previous year. The numbers of laid-off persons also remained nearly the same as in the quarters of 2011. (Table 1.)
Table 1. Temporarily laid-off persons aged 15–74 by quarter in 2010–2012
| Year | |||
| 2010 | 2011 | 2012 | |
| Quarter | Persons | Persons | Persons |
| I | 35,000 | 18,000 | 17,000 |
| II | 19,000 | 11,000 | 10,000 |
| III | 15,000 | 9,000 | 9,000 |
| IV | 14,000 | 11,000 | 11,000 |
| Annual average | 21,000 | 12,000 | 12,000 |
In 2012, 25 per cent of the temporarily laid-off persons were defined as unemployed, 32 per cent as employed and 43 per cent as belonging to the inactive population.
Source: Labour Force Survey 2012. Statistics Finland
Inquiries: Pertti Taskinen 09 1734 2690, Joanna Viinikka 09 1734 3796, tyovoimatutkimus@stat.fi
Director in charge: Riitta Harala
Updated 5.3.2013
Official Statistics of Finland (OSF):
Labour force survey [e-publication].
ISSN=1798-7857. Employment and unemployment 2012,
2 Not much change in unemployment in 2012
. Helsinki: Statistics Finland [referred: 26.4.2025].
Access method: http://stat.fi/til/tyti/2012/13/tyti_2012_13_2013-03-05_kat_002_en.html

