Published: 30 November 2012
Finland’s population includes 4.8 per cent of people with foreign origin
According to Statistics Finland's statistics on the population structure, there were 257,248 persons of foreign origin living in Finland at the end of 2011, which represents 4.8 per cent of Finland's population. There were 219,702 persons that have been born abroad, so-called first generation Finns with foreign origin, and 37,546 persons born in Finland with foreign origin, so-called second generation Finns with foreign origin.
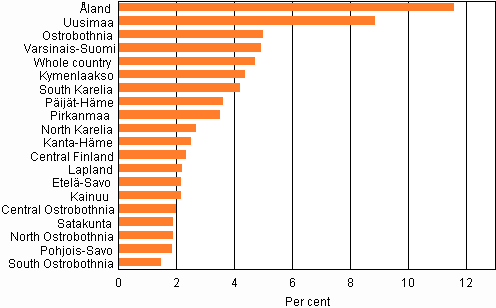
Share of people with foreign origin of the Finnish population on 31 December 2011

The share of people with foreign origin is highest in Åland and the Helsinki area
The number of people with foreign origin was highest in the Region of Åland, where their share of the population was 11.6 per cent and second highest in Uusimaa, 8.9 per cent. Of the persons with foreign origin living in Åland, nearly half were of Swedish origin. The share of the population with foreign origin was lowest in South Ostrobothnia, 1.5 per cent.
Population of foreign origin by region 31.12.2011
| Region | Origin | ||||||
| Population total | Foreign origin | 1st generation | 2nd generation | Proportion of poputation | Proportion of 1st generation | Proportion of 2nd generation | |
| WHOLE COUNTRY | 5 401 267 | 257 248 | 219 702 | 37 546 | 4,76 | 4,07 | 0,70 |
| MAINLAND FINLAND | 5 372 913 | 253 956 | 216 702 | 37 254 | 4,73 | 4,03 | 0,69 |
| Uusimaa | 1 549 058 | 137 678 | 115 100 | 22 578 | 8,89 | 7,43 | 1,46 |
| Varsinais-Suomi | 467 217 | 23 223 | 19 392 | 3 831 | 4,97 | 4,15 | 0,82 |
| Satakunta | 226 567 | 4 325 | 3 937 | 388 | 1,91 | 1,74 | 0,17 |
| Kanta-Häme | 175 230 | 4 443 | 3 968 | 475 | 2,54 | 2,26 | 0,27 |
| Pirkanmaa | 491 472 | 17 332 | 14 930 | 2 402 | 3,53 | 3,04 | 0,49 |
| Päijät-Häme | 202 236 | 7 406 | 6 481 | 925 | 3,66 | 3,20 | 0,46 |
| Kymenlaakso | 181 829 | 8 014 | 7 237 | 777 | 4,41 | 3,98 | 0,43 |
| South Karelia | 133 311 | 5 631 | 5 096 | 535 | 4,22 | 3,82 | 0,40 |
| Etelä-Savo | 153 738 | 3 386 | 3 041 | 345 | 2,20 | 1,98 | 0,22 |
| Pohjois-Savo | 248 130 | 4 697 | 4 195 | 502 | 1,89 | 1,69 | 0,20 |
| North Karelia | 165 906 | 4 527 | 4 131 | 396 | 2,73 | 2,49 | 0,24 |
| Central Finland | 274 379 | 6 521 | 5 736 | 785 | 2,38 | 2,09 | 0,29 |
| South Ostrobothnia | 193 735 | 2 950 | 2 640 | 310 | 1,52 | 1,36 | 0,16 |
| Ostrobothnia | 179 106 | 8 998 | 7 878 | 1 120 | 5,02 | 4,40 | 0,63 |
| Central Ostrobothnia | 68 484 | 1 382 | 1 218 | 164 | 2,02 | 1,78 | 0,24 |
| North Ostrobothnia | 397 887 | 7 583 | 6 505 | 1 078 | 1,91 | 1,63 | 0,27 |
| Kainuu | 81 298 | 1 784 | 1 610 | 174 | 2,19 | 1,98 | 0,21 |
| Lapland | 183 330 | 4 076 | 3 607 | 469 | 2,22 | 1,97 | 0,26 |
| ÅLAND | 28 354 | 3 292 | 3 000 | 292 | 11,61 | 10,58 | 1,03 |
| Åland | 28 354 | 3 292 | 3 000 | 292 | 11,61 | 10,58 | 1,03 |
Examined by municipality in Mainland Finland, the share of people with foreign origin was highest in Helsinki, 11.8 per cent, Vantaa, 11.2 per cent and Espoo, 10.5 per cent. The lowest shares were found in Rautavaara, Pelkosenniemi and Kiikoinen, 0.3 per cent.
Of all people with foreign origin, one-half lived in Uusimaa. Of the second generation Finns with foreign origin, 60 per cent lived in Uusimaa.
The share of people with foreign origin is highest among young adults
The effect of immigration on the age structure of our country can be seen among young adults. The share of people with foreign origin among 25-34 year-olds was 8.7 per cent at the end of 2011. In he Region of Åland, one-fifth of 25-34 year-olds were of foreign origin. In Uusimaa the share was 14.3 per cent.
The share of people with foreign origin among under school-age children (aged 0-6) was 5.6 per cent. In Åland and Uusimaa, one-tenth of children under school-age were of foreign origin.
59 per cent of people with foreign origin are of European origin
Examined by continent, 59 per cent of all persons with foreign origin were of European origin. The second largest group were people of Asian origin, whose share was 23 per cent, and the third largest were people of African origin, 12 per cent.
The share of Europeans among first generation Finns with foreign origin was 61 per cent, that of Asians was 23 per cent, and the share of Africans was 11 per cent. The share of Europeans among second generation Finns with foreign origin was 48 per cent, the share of Asians was 25 per cent, and that of Africans was 21 per cent.
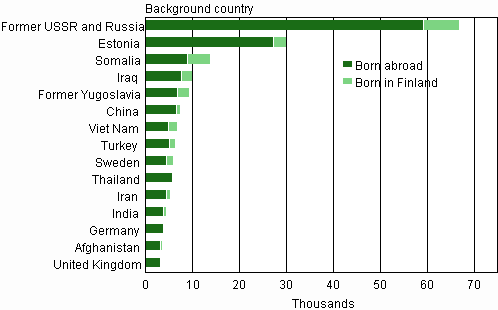
Examined by background country, the largest group by far among people with foreign origin are those whose background country is the former Soviet Union or Russia. There were 67,127 such persons in Finland at the end of 2011, representing 26 per cent of all people with foreign origin. The next biggest groups were people of Estonian origin, 30,250 persons, of Somalian origin, 13,930 persons, and of Iraqi origin, 10,072 persons.
Largest groups of foreign origin among the Finnish population on 31 December 2011

People of foreign origin are notably younger than the rest of the population
The age structure of people of foreign origin differs clearly from that of people of Finnish origin. The average age of the total population was 41.6 years at the end of 2011, and the average age of people of Finnish origin was 42.0 years. The average age among first generation Finns with foreign origin was 37.7 years, and the average age among second generation Finns with foreign origin was 11.8 years.
Among second generation Finns with foreign origin, 50 per cent were under school-age and 87 per cent were under the age of 18. The share of people of working age (aged 15–64) among the total population was 65 per cent. Among people with foreign origin, the share of people of working age was 77 per cent and among first generation Finns with foreign origin the share was 87 per cent.
Origin and background country are new classifications
Statistics Finland is adopting new origin and background country classifica-tions during 2012. Similar classifications are already used in the other Nordic countries. A person's origin and background country are usually determined based on their parents' country of birth. The determination of origin and background country is explained in more detail in the quality description of the statistics on the population structure.
Source: Population Structure 2011, Statistics Finland
Inquiries: Markus Rapo 09 1734 3238, vaesto.tilasto@stat.fi
Director in charge: Jari Tarkoma
Publication in pdf-format (424.2 kB)
- Tables
-
Tables in databases
Pick the data you need into tables, view the data as graphs, or download the data for your use.
Appendix tables
- Appendix table 1. Sizes of municipalities by region 31.12.2011 (30.11.2012)
- Appendix table 2. Married women by duration and order of marriage 31.12.2011 (30.11.2012)
- Appendix table 3. Women aged 15 - 76 by number of live-born children 31.12.2011 (30.11.2012)
- Appendix table 4. Men aged 15 - 76 by number of live-born children 31.12.2011 (30.11.2012)
- Appendix table 5. Women by age, number of children and the proportion of birth 31.12.2011 (30.11.2012)
- Appendix table 6. Men by age and number of children 31.12.2011 (30.11.2012)
- Appendix table 7. Religious affiliation of the population by age and sex 31.12.2011 (30.11.2012)
- Appendix table 8. Religious affiliation of the population 2003 - 2011 (30.11.2012)
- Figures
-
- Appendix figure 1. First generation Finns with foreign origin by age and gender, 31 December 2011 (30.11.2012)
- Appendix figure 2. Second generation Finns with foreign origin by age and gender, 31 December 2011 (30.11.2012)
- Appendix figure 3. Swedish-speakers' proportion of the population in 1900 - 2011 (30.11.2012)
- Appendix figure 4. Share of persons not belonging to religious communities by gender 1990 - 2011 (30.11.2012)
- Appendix figure 5. Demographic dependency ratio in 1950 - 2011 and projection for 2012 - 2050 (30.11.2012)
- Quality descriptions
-
- Quality description: Population structure 2011 (30.11.2012)
Updated 30.11.2012
Official Statistics of Finland (OSF):
Population structure [e-publication].
ISSN=1797-5395. annual review 2011. Helsinki: Statistics Finland [referred: 20.4.2025].
Access method: http://stat.fi/til/vaerak/2011/01/vaerak_2011_01_2012-11-30_tie_001_en.html

