Published: 15 July 2010
Gross domestic product decreased by 8 per cent last year
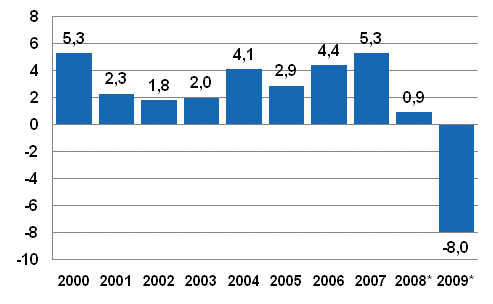
According to Statistics Finland’s revised preliminary data, Finland’s GDP contracted by 8.0 per cent last year. According to the initial preliminary data released in March, the decrease was 7.8 per cent. Gross domestic product, or the value added created in the production of goods and services, amounted to EUR 171 billion last year. Statistics Finland has also made revisions to National Accounts concerning the years 2007 to 2008. In 2007 gross domestic product grew by 5.3 per cent and in 2008 by 0.9 per cent. Previous estimates put the respective growth figures at 4.9 and 1.2 per cent.
Annual change in the volume of gross domestic product, per cent

The volume of value added decreased in almost all industries in 2009. Output diminished most in manufacturing and trade where value added contracted by one-fifth. The productivity of labour in the whole economy fell by 3.5 per cent last year.
Output was brought down by contraction in all demand items. Especially exports and investments collapsed. The volume of exports shrunk by 20 per cent and that of imports by 18 per cent. The volume of investments contracted by nearly 15 per cent. Inventories diminished last year for the first time in ten years. Private consumption expenditure decreased by 1.9 per cent last year but the volume of public consumption expenditure grew by 1.2 per cent.
Despite the economic downturn, households’ disposable income grew again last year, in real terms by 2.4 per cent. The growth was previously estimated to be one per cent. The data became revised because the accrued amounts of social security benefits (unemployment benefits) and property income exceeded earlier estimated. Wages and salaries received by households went down by 1.2 per cent, but social security benefits grew and taxation became lighter. Grown unemployment lowered income from wages and salaries even though the income level rose by four per cent. Social security benefits went up by 9.1 per cent, particularly pensions received grew.
Despite the growth in income households reduced their consumption so that the savings ratio became positive. Households’ financial position also went into a surplus of EUR 0.6 billion last year.
Non-financial corporations’ operating surplus, or operating profit, diminished by as much as 38 per cent in nominal terms from the previous year. Non-financial corporations paid 45 per cent less direct taxes and 15 per cent less dividends than in the previous year. Non-financial corporations decreased fixed investments in Finland by 22 per cent and also reduced their inventories substantially. Due to this non-financial corporations’ financial position showed a surplus of EUR 3.6 billion.
The financial position of general government worsened rapidly last year and instead of surplus showed a deficit of EUR 4.7 billion. The so-called EMU deficit of general government amounted to 2.5 per cent of GDP whereas earlier estimates had put the proportion at 2.2 per cent.
Source: National Accounts 2000–2009. Statistics Finland
Inquiries: Olli Savela (09) 1734 3316, Aila Heinonen (09) 1734 3338, skt.95@stat.fi
Director in charge: Ari Tyrkkö
Publication in pdf-format (266.6 kB)
- Reviews
- Tables
-
Tables in databases
Pick the data you need into tables, view the data as graphs, or download the data for your use.
Appendix tables
Updated 15.7.2010
Official Statistics of Finland (OSF):
Annual national accounts [e-publication].
ISSN=1798-0623. 2009. Helsinki: Statistics Finland [referred: 19.4.2025].
Access method: http://stat.fi/til/vtp/2009/vtp_2009_2010-07-15_tie_001_en.html

