Published: 12 July 2012
Gross domestic product went up by 2.7 per cent, growth in households’ income halted
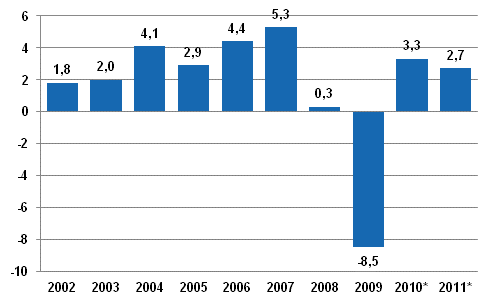
According to Statistics Finland’s revised preliminary data, the volume of Finland’s GDP grew by 2.7 per cent in 2011. The initial preliminary data released in March put the rate of growth at 2.9 per cent. Last year, GDP stood at EUR 189 billion. In real terms, GDP was still 3 per cent lower than in 2008. National income describing the income of the national economy went up by one per cent in real terms.
Annual change in the volume of gross domestic product, per cent

After the record plunge of 2009, the volume of value added went up again in most economic activities in 2011. In manufacturing, the growth was boosted most by the chemical industry and certain branches of the metal industry. In the electronics industry, in turn, value added decreased significantly. In services, the growth was boosted most by business activities, human health and social work activities, and real estate activities.
Output was increased by growth in all demand items. The fastest growth of 6.8 per cent was seen in investments. The volume of exports grew by 2.6 per cent and that of imports by 5.7 per cent. The volume of private consumption expenditure grew by 2.5 per cent and that of public consumption expenditure by 0.4 per cent.
Non-financial corporations’ operating surplus describing profits from their actual operations grew by 9 per cent in nominal terms but still remained clearly below the peak year of 2007. Non-financial corporations paid 12 per cent more direct taxes and approximately 23 per cent more dividends than in the previous year. The financial position of non-financial corporations showed a surplus of EUR 2.5 billion, or clearly less than in the previous year because investments and inventories increased.
By contrast, the financial position of general government was in deficit for the third successive year, by EUR 1.8 billion. In the previous year, the deficit was EUR 5 billion.
Growth in households’ real income halted last year. Households’ adjusted real income describing their economic well-being grew by only 0.2 per cent. Besides net income, adjusted income also takes into consideration the individual services that general government and organisations produce for households, such as educational, health and social services. Wage and salary income went up in nominal terms by 4.4 per cent, social security benefits by 3.7 per cent, and property and entrepreneurial income by 4.1 per cent.
National Accounts 2002-2011, Tables, PDF
Source: National Accounts, Statistics Finland
Inquiries: Olli Savela (09) 1734 3316, Aila Heinonen (09) 1734 3338, skt.95@stat.fi
Director in charge: Ari Tyrkkö
Publication in pdf-format (279.7 kB)
- Reviews
- Tables
-
Tables in databases
Pick the data you need into tables, view the data as graphs, or download the data for your use.
Appendix tables
- Revisions in these statistics
-
- Revisions on these statistics (12.7.2012)
Updated 12.7.2012
Official Statistics of Finland (OSF):
Annual national accounts [e-publication].
ISSN=1798-0623. 2011. Helsinki: Statistics Finland [referred: 19.4.2025].
Access method: http://stat.fi/til/vtp/2011/vtp_2011_2012-07-12_tie_001_en.html

