Published: 14 July 2016
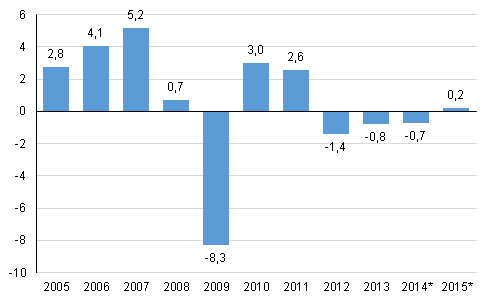
Gross domestic product grew by 0.2 per cent last year
According to Statistics Finland’s revised preliminary data, the volume of Finland’s GDP grew by 0.2 per cent in 2015. The initial preliminary data released in March put the rate of growth at 0.5 per cent. The GDP became revised as new data on intermediate goods used as production inputs in various industries in particular became available. Gross domestic product, or the value added created in the production of goods and services, amounted to EUR 209 billion.
Annual change in the volume of gross domestic product, per cent

Viewed by current price, value added increased most in computer and related services, the chemical industry, the forest industry and in some metal product sectors, business activities, water and air transport, and hotel and restaurant activities, and real estate activities. Value added decreased considerably in agriculture and insurance activities.
The volume of value added increased most in computer and related services, business activities and in the manufacture of basic metals. The volume of value added contracted considerably in insurance activities and in some sectors of manufacturing and transport.
Households’ consumption helped maintain demand
Demand in the national economy was mainly maintained by consumption; the volume of which grew by 1.1 per cent. The volume of private consumption grew by 1.5 per cent and the volume of public consumption expenditure by 0.4 per cent.
The volume of investments increased by 0.7 per cent. Private investments grew by 2.2 per cent but public investments decreased by 5.1 per cent. Especially investments in machinery and equipment increased. By contrast, investments in research and development and in software decreased.
The volume of exports shrunk by 0.2 per cent in 2015 and that of imports grew by 1.9 per cent. Because import prices declined by clearly more than export prices, imports at current prices contracted more than exports. The value of goods exports and imports decreased but the imports and exports of services increased.
Last year, net national income grew by 1.7 per cent in real terms, which was clearly more than the gross domestic product because the terms of trade or the ratio between export and import prices improved considerably.
Non-financial corporations’ profits grew
Non-financial corporations' operating surplus describing profits from their actual operations went up by eight per cent from the previous year. Non-financial corporations’ entrepreneurial income increased more, by 17 per cent, because dividend income increased and interest expenses decreased. Entrepreneurial income also takes into consideration property income and paid interests and rents, and corresponds roughly with profit before payment of taxes and dividends.
Non-financial corporations’ net lending, or financial position, showed a surplus of EUR 7.4 billion. The financial position weakened slightly despite the increase in profits because non-financial corporations’ investments and inventories increased.
General government’s net lending, or financial position, showed a deficit of EUR 5.8 billion, while the deficit was EUR 6.5 billion in the previous year. Last year, the deficit was 2.8 per cent relative to GDP, which was below the three per cent reference value of the European Union unlike in 2014.
Last year, the financial position of central government showed a notable deficit for the seventh successive year, EUR 6.3 billion. The deficit of local government (municipalities and joint municipal boards, etc.) was EUR 1.3 billion. The surplus of occupational pension funds diminished to EUR 2.7 billion from the previous year. The surplus does not include holding gains in assets. Other social security funds were EUR 0.8 billion in deficit mainly due to increased unemployment expenses.
The size of the public economy is described by general government's share of the gross value added, which was 20.4 per cent in 2015, having been 20.9 per cent one year earlier.
Households’ disposable income grew by 1.0 per cent in real terms. Households’ adjusted disposable income grew by 0.9 per cent in real terms. Adjusted income also takes into consideration welfare services, i.e. the individual services that general government and organisations produce for households, such as educational, health and social services.
Households’ wage and salary income went up by 1.0 per cent and social benefits by 3.2 per cent. The wage and salary income went up due to the risen level of earnings as employment weakened at the same time. Social benefits increased because the number of pensioners and unemployed grew. Households’ property and entrepreneurial income went up by 1.2 per cent.
National Accounts 2005 to 2015*, tables, PDF
Source: National Accounts.
Inquiries: Olli Savela 029 551 3316, Tuomas Rothovius 029 551 3360, kansantalous@stat.fi
Director in charge: Ville Vertanen
Publication in pdf-format (283.8 kB)
- Reviews
- Tables
-
Tables in databases
Pick the data you need into tables, view the data as graphs, or download the data for your use.
Appendix tables
- Revisions in these statistics
-
- Revisions on these statistics (14.7.2016)
Updated 14.7.2016
Official Statistics of Finland (OSF):
Annual national accounts [e-publication].
ISSN=1798-0623. 2015. Helsinki: Statistics Finland [referred: 19.4.2025].
Access method: http://stat.fi/til/vtp/2015/vtp_2015_2016-07-14_tie_001_en.html

