Published: 20 June 2019
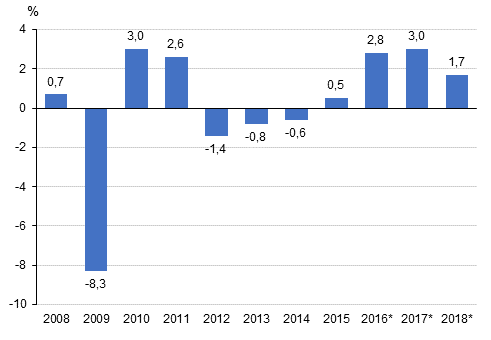
Gross domestic product grew by 1.7 per cent in 2018
According to Statistics Finland’s revised preliminary data, the volume of Finland’s GDP grew by 1.7 per cent in 2018. The initial preliminary data released in March put the rate of growth at 2.3 per cent. Gross domestic product, or the value added created in the production of goods and services, amounted to EUR 232 billion. The downwards revision of GDP was mainly due to annual data on purchases made by enterprises being received, which increased intermediate consumption.
Annual change in the volume of gross domestic product, per cent

The calculation for 2017 has also become revised. In 2017, the volume of GDP increased by 3.0 per cent whereas previous estimates put the growth at 2.7 per cent. The current priced value of the GDP remained at the level of the March release, at EUR 224 billion. The volume revision was caused by the product structure being updated.
Supply
The value of output grew by 4.7 per cent to EUR 436 billion in 2018. The volume of output grew by 1.8 per cent and output prices increased by 2.8 per cent. The value of intermediate consumption increased by 5.8 per cent to EUR 236 billion. The volume of intermediate consumption went up by 2.5 per cent.
Intermediate consumption was revised upward more than output compared to the calculation round in March. Therefore, gross domestic product at current prices was revised downward. The data sources for compiling intermediate consumption are now clearly more extensive than in the preliminary data released in March because quarterly data have been complemented with annual data. Annual data for some industries are also available for turnover data.
In 2018, the value of value added amounted to EUR 200 billion. The value of taxes on products was EUR 33 billion and the value of product subsidies was EUR 0.9 billion. The value of gross domestic product calculated from these items was EUR 232 billion.
The 7.6 per cent increase in the value of imports boosted total supply. The value of goods imports rose by 7.2 per cent and that of service imports by 8.4 per cent. Import prices increased by 3.3 per cent and the volume of imports grew by 4.1 per cent.
Demand
The value of exports, EUR 91 billion, grew by 5.4 per cent in 2018. Prices of export products went up by 4.3 per cent and the volume of exports increased by 1.1 per cent.
The value of the biggest demand item, private consumption expenditure, increased by three per cent to EUR 125 billion. The value of government consumption expenditure grew by 3.4 per cent to EUR 53 billion. The volume of consumption expenditure grew in total by 1.8 per cent.
The current price value of investments increased by five per cent to EUR 53 billion. The volume of investments went up by three per cent. Building investments in particular were growing. The change in inventories was exceptionally high in 2018. The value of inventories grew by EUR 2.8 billion and growth came from several industries. Growth was strongest in the manufacturing of pulp, paper, paper board and cardboard and in boatbuilding.
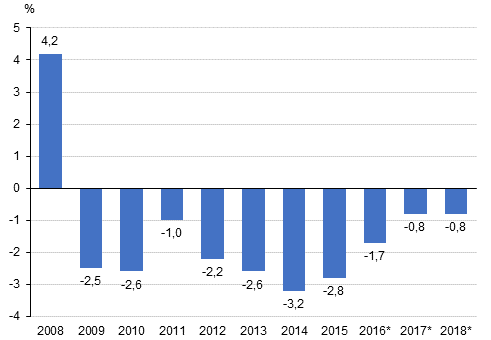
General government deficit on level with 2017
The financial position of general government or net lending remained on the 2017 level and was EUR 1.8 billion in deficit in 2018. The deficit was 0.8 per cent relative to GDP.
General government surplus / deficit relative to GDP, per cent

The deficit of central government was EUR 2.8 billion, while one year before it was EUR 4.0 billion. The growth in tax revenue particularly lowered the deficit. The deficit of local government (municipalities and joint municipal authorities, etc.) grew to EUR 2.0 billion.
The surplus of employment pension schemes grew from EUR 2.0 billion to EUR 2.3 billion, although the amount of pensions paid by employment pension schemes continued growing. The surplus includes investment income but not holding gains in assets. Other social security funds showed a surplus of EUR 0.7 billion.
General government's share of the gross value added was 18.8 per cent in 2018, which is 0.1 percentage points more than in the year before.
Wages and salaries received by households grew
Wages and salaries received by households grew in nominal terms by 4.1 per cent. This was caused by an increase in employment. Households’ consumption expenditure increased by 3.2 per cent and households’ saving was EUR 0.4 billion negative. Households’ saving rate was -0.4 per cent.
Changes in these statistics
Changes have been made to the calculation of the national accounts preliminary data. Simultaneously, the publication time for summer is some three weeks earlier. More information on this: Revised data content of the national accounts and release schedule for 2019 .
Source: National Accounts 2018, preliminary data. Statistics Finland
Inquiries: Tapio Kuusisto 029 551 3318, Jarkko Kaunisto 029 551 3551, kansantalous@stat.fi
Director in charge: Ville Vertanen
Publication in pdf-format (246.4 kB)
- Tables
-
Tables in databases
Pick the data you need into tables, view the data as graphs, or download the data for your use.
Appendix tables
- Gross domestic product (GDP) 1975-2018* (20.6.2019)
- Revision of annual volume change, % (20.6.2019)
- Revisions in these statistics
-
- Revisions on these statistics (20.6.2019)
Updated 20.6.2019
Official Statistics of Finland (OSF):
Annual national accounts [e-publication].
ISSN=1798-0623. 2018. Helsinki: Statistics Finland [referred: 26.4.2025].
Access method: http://stat.fi/til/vtp/2018/vtp_2018_2019-06-20_tie_001_en.html

