4. Young adults the most indebted
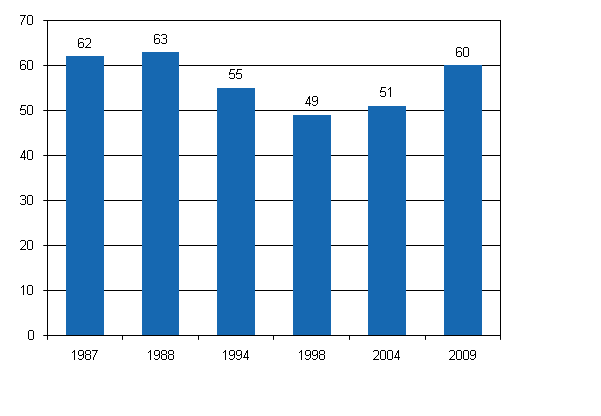
While indebtedness of households has increased, not nearly all Finns have debts. In 2009, 1.5 million households, or 60 per cent of all households, had a housing loan, a study loan or other debts. As regards the share of households with debts, we are currently approaching the figures recorded during the period of financial and property market upheavals in the 1980s, and debt amounts have increased considerably (Figure 4).
Figure 4. The share of households with debts in 1987–2009, per cent of households

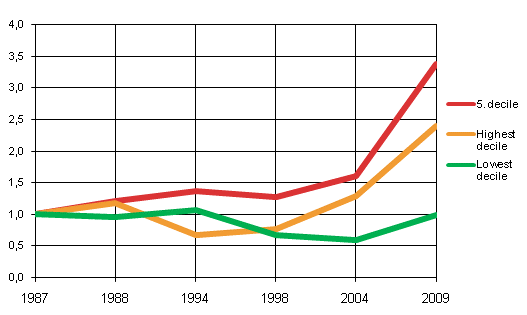
In addition to income, wealth also plays a role in indebtedness, as the least wealthy may have limited possibilities of contracting debts. Figure 5 shows an index describing indebtedness trends for various levels of gross wealth from 1987. For the least wealthy (1st decile), the amount of debt in real terms was at the same level in 2009 as it was in 1987. On the other hand, the debts of the wealthiest (10th decile) were nearly 2.5-fold compared to 1987. Around the middle of the wealth distribution (5th decile), the amount of debt has increased at an even faster rate, or nearly 3.5-fold.
Figure 5. Index describing the amount of debt in the lowest, 5th and highest deciles of gross wealth in 1987–2009, (year 1987=1)

Similarly to wealth and income, debt also shows significant variations in different stages of life. The households of young adults aged 25 to 34 displayed the greatest debt amounts in proportion to their disposable income. While the proportion of debts to income in all households was 80 per cent, for those aged 25 to 34, this proportion was more than two-fold (179%). In proportion to income, the debt burden of the most indebted groups may exceed one hundred per cent, as in the calculations, the debt amount is examined in proportion to annual income.
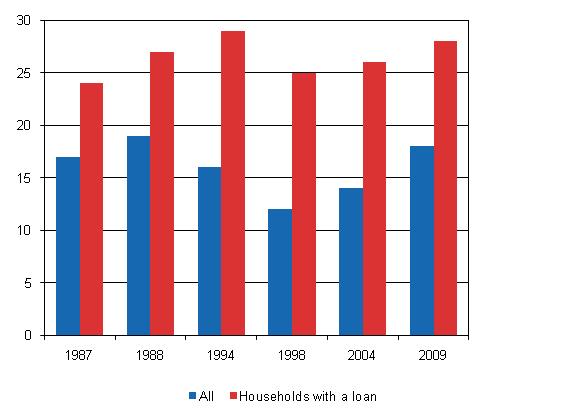
However, debts are paid back over a number of years. As a key figure for indebtedness, debt burden, or a figure calculated in proportion to gross wealth, can also be used. The debt burden was, on average, 18 per cent in 2009, with an increase of some six percentage points over ten years. This figure for indebted households was 28 per cent (Figure 6).
Figure 6. Debt burden (proportion of debts to assets) for all households and households with debts, per cent

Some 34 per cent had housing loans, and the share of these loans in debts was 76 per cent. One out of three households (35%) had an owner-occupied dwelling that was completely free from debt. While only five per cent of those aged 25 to 34 had an owner-occupied dwelling free from debt, this share for those aged 65 or over was as high as around 70 per cent.
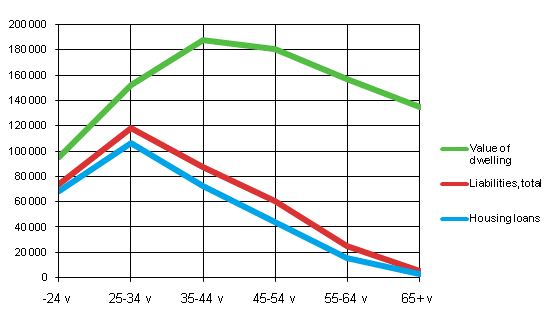
The number of households living in owner-occupied dwellings was 1.7 million. When we look at the values of owner-occupied dwellings and housing loans in this context, we see that in the younger age groups, the amounts of housing loans initially increase sharply, but the asset value of owner-occupied dwellings also goes up (Figure 7). However, the debt burden reduces from one age group to the next, and once retirement age is reached, the debts have nearly been paid. While the households of young adults (aged 25 to 34) living in owner-occupied dwellings had an average debt of nearly EUR 120,000, this figure for those aged 65 or over was only an average of EUR 5,000. The debt burden of households of those aged 25 to 34 was 59 per cent, whereas the debt burden for households of those aged 65 or over was two per cent.
Figure 7. Value of dwelling of households living in an owner-occupied dwelling, total of debts and housing loans by age group in 2009, EUR per household living in an owner-occupied dwelling

Source: Households' assets
Inquiries: Markku Säylä (09) 1734 3410, Veli-Matti Törmälehto (09) 1734 3680
Director in charge: Riitta Harala
Updated 21.12.2011
Official Statistics of Finland (OSF):
Households' assets [e-publication].
ISSN=2242-3230. 2009,
4. Young adults the most indebted
. Helsinki: Statistics Finland [referred: 26.4.2025].
Access method: http://stat.fi/til/vtutk/2009/vtutk_2009_2011-12-21_kat_004_en.html

