Published: 1 April 2015
Half of all households had a net wealth of EUR 110,000 or more in 2013
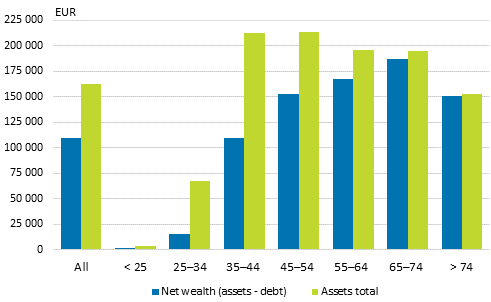
Statistics Finland's Household Wealth Survey for 2013 indicates that the median for households' net wealth was EUR 110,000 in 2013. Median wealth was in real terms 4.7 per cent higher than in the previous study in 2009. Wealth is divided unevenly, because one-quarter of households had a net wealth of over EUR 252,000 and one-quarter under EUR 10,000. Those aged 65 to 74 were the wealthiest age group.
Average wealth according to the age of the household's reference person in 2013, median

The wealthiest tenth owned around 45 per cent of total net wealth in 2013. The five least wealthy deciles, or one-half of households, owned around seven per cent of net wealth. Examined in the long term, the share of the wealthiest decile in net wealth has grown. Compared with 1994, the wealth share of the wealthiest decile has risen by around six percentage points.
Distribution of net wealth in 1994 and 2013, share of total amount of net wealth (%)
| Net wealth decile group | 1994 | 2013 | Change (percentage points) |
| I–V (least wealthy 50 %) | 6,9 | 6,7 | -0,2 |
| VI | 8,2 | 6,9 | -1,3 |
| VII | 10,9 | 9,6 | -1,3 |
| VIII | 14,5 | 13,0 | -1,5 |
| IX | 20,3 | 18,7 | -1,6 |
| X (wealthiest 10 %) | 39,2 | 45,2 | 6,0 |
| Total | 100 | 100 | 0 |
Source: Households' assets
Inquiries: Veli-Matti Törmälehto 029 551 3680, Juha Honkkila 029 551 3651
Director in charge: Riitta Harala
- Tables
-
Tables in databases
Pick the data you need into tables, view the data as graphs, or download the data for your use.
Updated 1.4.2015
Official Statistics of Finland (OSF):
Households' assets [e-publication].
ISSN=2242-3230. 2013. Helsinki: Statistics Finland [referred: 19.4.2025].
Access method: http://stat.fi/til/vtutk/2013/vtutk_2013_2015-04-01_tie_001_en.html

