Published: 11 September 2014
Households pay 45 per cent of environmental taxes
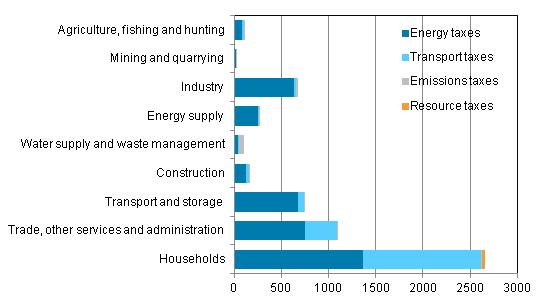
The accrual of environmental taxes went down slightly in 2012 as transport taxes and emission taxes decreased. The total sum of taxes was EUR 5.8 billion, of which households paid nearly EUR 2.7 billion. Environmental taxes in manufacturing amounted to close on EUR 0.7 billion and taxes in the transportation and storage industry were good EUR 0.7 billion. Environmental taxes accounted for nearly seven per cent of the entire tax revenue of the state in 2012. These data appear from Statistics Finland's statistics on environmental taxes by industry.
Environmental taxes by industry group and tax type in 2012, EUR million

Over one half of the environmental taxes paid by households, EUR 1.4 billion, were energy taxes and EUR 1.2 billion transport taxes. In the transportation and storage industry, most environmental taxes were levied from land transport, over EUR 0.5 billion. The majority of the environmental taxes in manufacturing was paid by the industry group of oil refining and manufacture of chemicals, where environmental taxes totalled nearly EUR 0.5 billion. In energy supply, environmental taxes amounted to EUR 267 million, in real estate activities to EUR 263 million, in construction to EUR 163 million, and in trade to EUR 160 million.
Environmental taxes by industry and tax type in 2012, EUR million
| Energy taxes | Transport taxes | Emissions taxes | Resource taxes | Environmental taxes total | |
| Industries | |||||
| Agriculture, fishing and hunting | 57,3 | 16,1 | 0,0 | – 1) | 73,4 |
| Forestry | 28,6 | 4,0 | 0,2 | – | 32,7 |
| Mining and quarrying | 20,5 | 3,0 | 0,1 | – | 23,5 |
| Food industry | 15,3 | 1,7 | 0,0 | – | 17,0 |
| Forest industry | 69,7 | 2,0 | 0,3 | – | 72,0 |
| Oil refining and manufacture of chemicals | 466,9 | 0,8 | 24,9 | – | 492,6 |
| Manufacture of basic metals and metal products | 46,1 | 4,2 | 0,1 | – | 50,4 |
| Other manufacturing | 36,6 | 10,5 | 0,2 | – | 47,3 |
| Energy supply | 248,9 | 18,0 | 0,1 | – | 267,0 |
| Water supply and waste management | 41,6 | 10,0 | 56,0 | – | 107,6 |
| Constraction | 126,0 | 36,7 | 0,1 | – | 162,8 |
| Trade | 94,5 | 64,9 | 0,2 | – | 159,6 |
| Land transport and transport via pipelines | 485,1 | 57,9 | 0,8 | – | 543,7 |
| Water transport | 93,4 | 0,2 | 0,0 | – | 93,7 |
| Air transport | 27,4 | 0,7 | 0,0 | – | 28,2 |
| Support activities for transportation, post | 73,8 | 4,8 | 0,3 | – | 78,8 |
| Real estate activities | 239,6 | 23,2 | 0,1 | – | 262,9 |
| Other services and administration | 420,2 | 245,6 | 2,8 | – | 668,7 |
| Households | 1 370,5 | 1 247,9 | 13,1 | 24,0 | 2 655,5 |
| TOTAL | 3 962,0 | 1 752,0 | 99,2 | 24,0 | 5 837,1 |
Environmental taxes are comprised of energy taxes, transport taxes, emission taxes and resource taxes. Two-thirds of the total sum of environmental taxes are energy taxes on electricity and fuels. Nearly one-third of environmental taxes consists of various transport taxes levied from vehicles. The share of emission taxes makes up under two per cent of Finland's environmental taxes, most of this being waste taxes. The resource taxes in Finland are licence fees for hunting and fishing.
The statistics on environmental taxes by industry are calculated yearly according to the EU Regulation on environmental accounts. The statistics on environmental taxes by industry are part of environmental accounts, where the main principle is to describe the interaction between the environment and the economy. In the statistics, environmental taxes are presented according to the industrial classification used in national accounts. In this way, the data can be directly connected to various monetary variables of national accounts, such as total output and value added. Data on environmental taxes by industry can also be combined to data on emissions into air by industry.
Source: Environmental taxes 2012, by industry
Inquiries: Niina Autio 029 551 3406, Jukka Muukkonen 029 551 3224, ymparisto.energia@stat.fi
Director in charge: Leena Storgårds
Publication in pdf-format (259.5 kB)
- Tables
-
Tables in databases
Pick the data you need into tables, view the data as graphs, or download the data for your use.
Appendix tables
- Appendix table 1. Total environmental taxes by industry 2008 to 2012, EUR million (11.9.2014)
- Appendix table 2. Energy taxes by industry 2008 to 2012, EUR million (11.9.2014)
- Appendix table 3. Transport taxes by industry 2008 to 2012, EUR million (11.9.2014)
- Appendix table 4. Emission taxes by industry 2008 to 2012, EUR million (11.9.2014)
- Appendix table 5. Resource taxes by industry 2008 to 2012, EUR million (11.9.2014)
Updated 11.9.2014
Official Statistics of Finland (OSF):
Environmental and energy taxes [e-publication].
ISSN=2341-796X. by industry 2012. Helsinki: Statistics Finland [referred: 19.4.2025].
Access method: http://stat.fi/til/yev/2012/01/yev_2012_01_2014-09-11_tie_001_en.html

