Published: 10 September 2020
Majority of environmental taxes in 2018 were energy taxes - households paid one-third of them
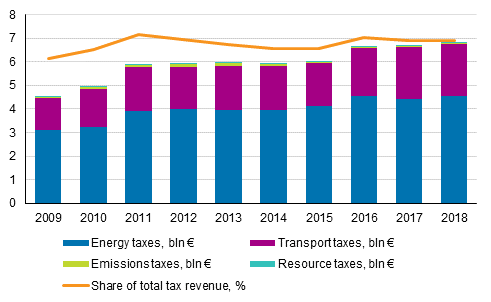
In 2018, the accrual of environmental taxes grew by around two per cent to EUR 6.8 billion. The share of environmental taxes of the total tax revenue remained unchanged at around seven per cent. Environmental taxes in manufacturing went up by 12 per cent from the previous year. Taxes paid by households remained on level with the previous year. However, households still paid the highest share of environmental taxes, 47 per cent of the entire accrual.
Environmental taxes by tax category and share of total tax revenue in 2009 to 2018

Around EUR 4.5 billion, or two-thirds of all environmental taxes, were generated from energy taxes on electricity and fuels. Energy taxes also include strategic stockpile fees and emissions trading. Another significant tax group was transport taxes, which are collected especially as vehicle and car taxes. The accrual of transport taxes amounted to EUR 2.2 billion, or nearly one-third of environmental taxes.
The share of environmental taxes in total tax revenue remained unchanged at 6.9 per cent, which is slightly higher than the average six per cent for EU countries. Over the past ten years, the share of environmental taxes in all taxes has varied between 6.2 and 7.2 per cent. The share was at its highest in 2011, especially due to tightening taxation of energy and electricity.
Environmental taxes by industry and tax type in 2018, EUR million
| Energy taxes | Transport taxes | Emissions taxes | Resource taxes | Environmental taxes total | |
| Industries | |||||
| Agriculture, forestry and fishing | 105.7 | 55.5 | 0.3 | . | 161.5 |
| Mining and quarrying | 44.3 | 4.4 | 0.1 | . | 48.8 |
| Manufacturing | 816.4 | 43.3 | 26.6 | . | 886.3 |
| Energy supply | 484.9 | 15.2 | 0.0 | . | 500.1 |
| Water supply and waste management | 34.0 | 7.9 | 7.0 | . | 48.9 |
| Construction | 125.0 | 69.9 | 0.0 | . | 194.9 |
| Trade | 90.7 | 61.7 | 2.4 | . | 154.8 |
| Transport and storage | 756.0 | 127.6 | 0.7 | . | 884.3 |
| Other service activities and administration | 562.5 | 147.5 | 0.3 | . | 710.3 |
| Households | 1 519.5 | 1 679.6 | 0.4 | 27.0 | 3 226.5 |
| TOTAL | 4 539.0 | 2 212.6 | 37.8 | 27.0 | 6 816.4 |
Accrual of energy taxes grew by two per cent in 2018. The increases to taxes on power plant and heating fuels that entered into force at the beginning of the year did not significantly increase the revenue. The use of more heavily taxed hard coal and fuel oils decreased and they were replaced by more lightly taxed natural gas and peat.
The share of energy taxes paid by households fell slightly from the previous year, but still formed one-third of the entire energy tax revenue. Energy taxes paid by manufacturing went up by around 14 per cent, corresponding to nearly one-fifth of the total revenue. The other most significant payers of energy taxes were the industries of energy supply and transport.
Transport taxes remained on level with 2017 as the tax accrual rose by around one per cent. The increase in first registrations of passenger cars increased paid car taxes, the accrual of which grew by around two per cent despite the gradual tax reduction to car tax. The majority, 76 per cent, of transport taxes were paid by households.
In addition, EUR 38 million in emission taxes were collected in 2018. The emission taxes comprise waste tax, excise duty on beverage containers, oil waste duty and oil damage duty. The accrual of emission taxes has decreased to around one half from 2009. The revenue has reduced especially due to the decrease in landfill disposal of waste. Nowadays, the majority of emission taxes are excise duties on beverage containers.
In 2018, EUR 27 million in hunting and fishing licence fees were collected from households as resource taxes, which was EUR five million more than in the year before. The revenue grew particularly due to an increase in game management fees.
Source: Environmental taxes 2018, by industry, Statistics Finland
Inquiries: Juuso Peltola 029 551 2330, Johanna Pakarinen 029 551 3313, ymparistotilinpito@stat.fi
Head of Department: Mari Ylä-Jarkko
Publication in pdf-format (168.6 kB)
- Tables
-
Tables in databases
Pick the data you need into tables, view the data as graphs, or download the data for your use.
Updated 10.9.2020
Official Statistics of Finland (OSF):
Environmental and energy taxes [e-publication].
ISSN=2341-796X. by industry 2018. Helsinki: Statistics Finland [referred: 16.4.2025].
Access method: http://stat.fi/til/yev/2018/01/yev_2018_01_2020-09-10_tie_001_en.html

