Published: 16 December 2021
Profitability of enterprises improved in manufacturing, trade and construction measured by operating margin in 2020
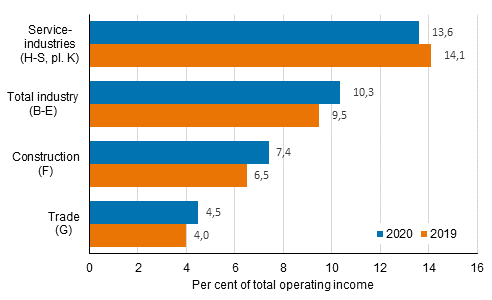
Despite the coronavirus, the profitability of manufacturing, construction and trade enterprises improved in 2020 measured by operating margin compared to 2019. The gross margin coefficient in manufacturing and construction grew by 0.9 percentage points and in trade by 0.5 percentage points. By contrast, the profitability of service industries weakened by 0.5 percentage points. Without the support paid to the service sector, profitability would have weakened by slightly over one percentage point. Turnover grew in trade and construction in 2020, but fell in manufacturing and service industries. In manufacturing, operating expenses decreased more than the fall in turnover and other operating income, which was visible as an increase in the gross margin coefficient.
Enterprises’ operating margin in 2019 to 2020

Among service industries, profitability measured by the operating margin weakened particularly in transportation and storage, accommodation and food service activities, and arts, entertainment and recreation activities. COVID-19 and the restrictions made because of it had a particularly strong effect in these industries. The profitability of service industries also weakened compared to 2019 measured by the operating income percentage, in all by 1.8 percentage points.
The profitability of manufacturing enterprises improved when measured with the operating margin particularly in the electronics industry and in the manufacture of other transport equipment. Measured by the operating income percentage, the profitability of manufacturing stayed on the same level as the previous year. In trade and construction, profitability also improved when measured by the operating income percentage: in trade by 0.4 percentage points and in construction by 1.0 percentage points.
The ratio of income before extraordinary items to operating income of enterprises weakened in the industries of manufacturing, trade and other services. In construction, the ratio of income before extraordinary items to operating income grew by 1.0 percentage points. In manufacturing and trade, the ratio of income before extraordinary items to operating income contracted especially due to reductions in value reported in financial expenses. The net income percentage and the total result percentage also declined in manufacturing, trade and services. The corresponding indicators for construction showed growth.
Enterprises’ income before extraordinary items in 2019 to 2020

The information in the above paragraphs is based on the financial statement statistics of enterprises, where data can be found on industry (TOL B to E), construction (TOL F), trade (TOL G) and other services apart from financial and insurance activities (TOL H to S, excl. K).
Number of enterprises decreased slightly in 2020
There were 368,600 enterprises in 2020. The number of enterprises fell by 0.4 per cent from 2019. The number of enterprises fell most in agriculture and forestry, where the number of enterprises went down by 3,900, or by around 5.0 per cent. In turn, the number of enterprises increased most in professional, scientific and technical activities, where the number went up by 1,200, or 3.3 per cent. In percentages, the number of enterprises increased most in financial and insurance activities, where the number of enterprises grew by 10.2 per cent compared with 2019.
In accommodation and food service activities, and arts, entertainment and recreation, the industries hardest hit by COVID-19, even growth was visible in the number of enterprises. In accommodation and food service activities, the number of enterprises grew moderately by 16 enterprises, or by 0.1 per cent. The increase is explained by the growing number of enterprises in the accommodation industry. In arts, entertainment and recreation activities, the number of enterprises grew by 91 enterprises, or by 1.0 per cent from one year ago. In transportation and storage, the number of enterprises fell by 71, or by 0.4 per cent. The fall in the industry was moderate especially due to the growing number of enterprises engaged in post and courier activities.
The information in the two preceding paragraphs is based on the data of the business structures statistics, which cover all industries, including primary production (TOL A), as concerns the final data released in December. In real estate activities (TOL 68), part of the turnover may be visible in other operating income in 2020 due to a change in the reporting mode of the business tax form used as data sources.
More information on the development of enterprises in the coronavirus year 2020 are found in the review (in Finnish)
Data basis of the statistics
The data of the structural business and financial statement statistics are based on the data on enterprises defined by Statistics Finland. An enterprise is an independent unit in its decision-making that produces goods and/or services for sale on the market. An enterprise is formed from one or more legal units (Business ID). The data are based on the Tax Administration's business taxation data. The data have been supplemented with Statistics Finland's own inquiry. Separate tables on non-profit institutions can be found in connection with the statistics.
Database tables are published from the structural business and financial statement statistics based on both enterprises and legal units (Business IDs).
Data describing establishments of enterprises can be found in the regional statistics on entrepreneurial activity . More detailed data on foreign affiliates operating in Finland can be found in the statistics on foreign affiliates in Finland . These enterprises are also included in the structural business and financial statement statistics.
Source: Statistics Finland
Inquiries: Milka Suomalainen 029 551 3621, Mira Kuussaari 029 551 3538, Anna-Maija Laakko 029 551 3640, rakenne.tilastot@stat.fi
Head of Department in charge: Katri Kaaja
Publication in pdf-format (227.2 kB)
- Tables
-
Tables in databases
Pick the data you need into tables, view the data as graphs, or download the data for your use.
Appendix tables
- Revisions in these statistics
-
- Revisions in these statistics (16.12.2021)
Updated 16.12.2021
Official Statistics of Finland (OSF):
Structural business and financial statement statistics [e-publication].
ISSN=2342-6233. 2020. Helsinki: Statistics Finland [referred: 18.4.2025].
Access method: http://stat.fi/til/yrti/2020/yrti_2020_2021-12-16_tie_001_en.html

