This set of statistics has been discontinued.
Statistical data on this topic are published in connection with another set of statistics.
Data published after 5 April 2022 can be found on the renewed website.
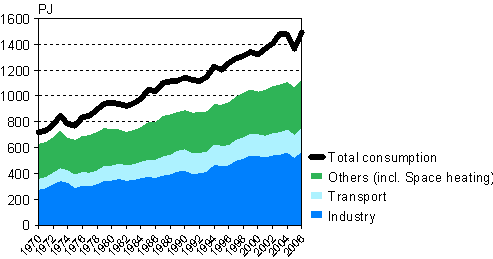
Total energy consumption rose clearly
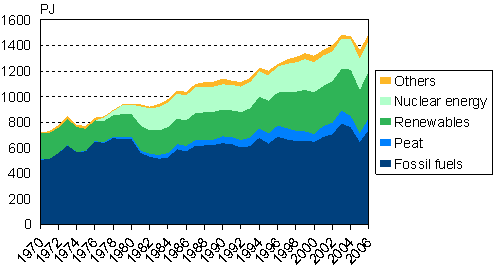
Total consumption of energy in Finland rose by nine per cent in 2006 from the previous year and amounted to 1,492 petajoule (PJ), corresponding to 35.6 Mtoe. Final consumption of energy increased by aroud five per cent. Final energy consumption is derived by deducting transmission and transformation losses from total energy consumption. It thus refers to the amount of energy left for the use of enterprises, households and other consumers. Consumption of electricity rose to 90 terawatt hours (TWh), an increase of six per cent.
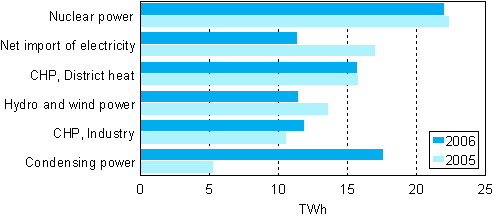
Total energy consumption rose primarily because production of condensate electricity more than tripled from its low level in the previous year, production of hydro power diminished by 16 per cent and net imports of electricity fell by 33 per cent. This was because the demand for electricity grew at the same time as little hydro power was available in the Nordic countries. The production of condensate electricity and, respectively, the consumption of fuels for it, fluctuate strongly from year to year according to the availability of Nordic hydro power. Production of condensate power is high during dry periods but very low during years with plentiful water supplies. The reason for the increase in final energy consumption and consumption of electricity was industry's risen demand for energy. Due to, among other things, the labour dispute in the forest industry, the demand for energy in industry was low in 2005.
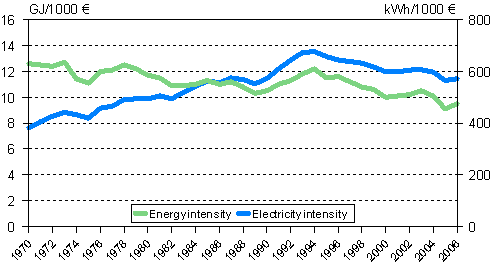
According to revised preliminary data of Statistics Finland, the volume of gross domestic product grew by five per cent in 2006. Output increased by 10 per cent in processing industries and by four per cent in services from the previous year. According to the preliminary data of the Volume Index of Industrial Output, output in all manufacturing grew by approximately eight per cent, in which growth of output in the wood and paper industry amounted to for 11 per cent. Industry's energy consumption rose in step with the growth in the output of energy-intensive industries. Energy consumption in transport increased slightly. Energy intensity, or the relation of total energy consumption to gross domestic product, turned upwards again after the decline that had started in 2003. Electricity intensity also increased, albeit more moderately than energy intensity.
Total Energy Consumption and Final Energy Consumption by Sector 1970-2006
Energy and Electricity Intensity 1970-2006
Use of fossil fuels and peat increased considerably
The use of fossil fuels increased by 15 per cent and the use of peat by 36 per cent from the previous year. Among fossil fuels, consumption of coal increased most; its use in energy production more than doubled. Consumption of coal, inclusive of coke, blast furnace gas and coke oven gas, went up by 66 per cent. Among these, consumption of coke decreased by three per cent, whereas those of blast furnace gas and coke oven gas increased by four per cent. The use of natural gas went up by seven per cent from the year before. The considerable growth in the use of fossil fuels and peat came from increased production of condensate electricity. The use of fossil fuels and peat in combined heat and power production also went up, because industry's energy demand rose and the need of heating energy went up due to the slightly cooler weather than in the previous year.
The use of oil increased by one per cent in 2006. Like other power plant fuels, the consumption of heavy fuel oil also went up, by approximately four per cent. Despite the increased need for heating energy, the consumption of light fuel oil that is mainly used for heating decreased by approximately four per cent from the year before. Of transportation fuels the sale of petrol stayed on level with the previous year, while that of diesel grew by three per cent.
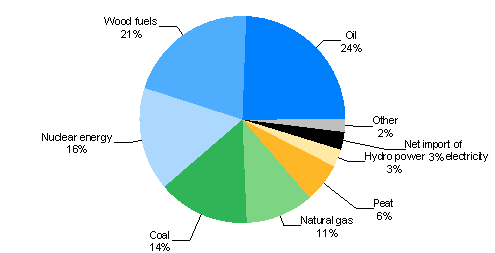
Energy Sources 2006
Consumption of Energy Sources 2005-2006
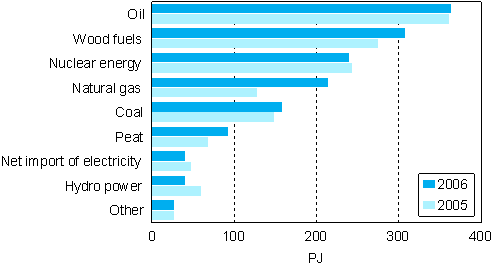
The use of renewable energy also increased clearly, or by eight per cent from the year before. Its use returned to the level of 2004 after the brief decline that was caused by the labour dispute in the forest industry in 2005. Of wood fuels, the use of black liquor increased most, or by 18 per cent. The use of wood fuels in industry and small combustion of wood also increased. Production of hydro and wind power diminished.
Fossil Fuels and Renewables 1970-2006
Production of electricity went up
In 2006, consumption of electricity rose to 90 TWh. The growth from the year before amounted to six per cent. The growth was due to risen consumption of industry, which primarily came as a consequence of the fall in consumption that was caused by the previous year's labour dispute in the forest industry. Electricity use of both households and services went up by approximately three per cent.
Domestic electricity production went up by slightly more than consumption, or by 16 per cent. However, own electricity production, which totalled 79 TWh, failed to reach the figures of the peak years of 2003 and 2004, when over 90 per cent of the electricity consumed in Finland was home produced. In particular, production of condensate electricity increased substantially: it more than tripled. The amount of electricity produced by co-generation of electricity and heat in industry also increased. The amount of electricity produced in connection with district heating remained almost unchanged. Slightly less than average hydro power was produced. The produced amount was as much as 16 per cent lower than in 2005. Production of nuclear power also diminished somewhat.
Less electricity was imported into Finland in 2006 than in the year before even though imports from Russia increased. The year was exceptionally dry in the Nordic countries right up to late autumn, so production of hydro power diminished in Norway, Sweden and Finland. Much like in earlier exceptionally dry years, Finland became a net exporter to the west because of this.
Electricity Supply 2005 - 2006
Carbon dioxide emissions went up by 21 per cent
According to Statistics Finland's data, carbon dioxide emissions from the combustion of fossil fuels and peat went up in Finland by 21 per cent from the previous year, and amounted to 64 million tonnes in 2006. The increase came from growth in total consumption or energy and replacement of electricity imports and hydro power with condensate power.
Emissions almost rose to the level of 2004, and emissions from fuel combustion exceeded the 1990 target by over 21 per cent. Total consumption of energy was nearly one third higher last year than in 1990. The share of renewable energy sources in total energy consumption has grown and that of fossils decreased, which is why carbon dioxide emissions have grown by less than consumption. The relative decrease in emissions has also been influenced by grown consumption of natural gas in relation to other fossil fuels.
Final consumption of energy went up in industry
Statistics Finland's data indicate that final consumption of energy went up by above five per cent in 2006, and totalled just under 1,123 PJ. Final energy consumption measures the consumption of energy end-products, i.e. electricity, district heating, fuels used for space heating, transportation fuels, and industrial processing fuels. The difference between total and final consumption derives from transformation and transmission losses of energy.
Final consumption of energy increased most in industry last year. The growth is attributable to increased production in energy-intensive industries, especially mining and quarrying, and the wood and paper industry. The use of energy in transport went up slightly from the year before.§%£ko§%£
Last updated 12.12.2007
Official Statistics of Finland (OSF):
Energy consumption [e-publication].
ISSN=1798-6869. 2006,
Total energy consumption rose clearly
. Helsinki: Statistics Finland [referred: 20.4.2025].
Access method: http://stat.fi/til/ekul/2006/ekul_2006_2007-12-12_kat_001_en.html

