Published: 16 June 2021
Waste generated in 2019 declined due to lower amoung of waste from mining and quarrying and construction
Over 116 million tonnes of waste were generated in 2019. This is nearly 12 million tonnes less than in the previous year, when the amount of waste had risen mainly due to waste caused by mining and quarrying. The decrease in 2019 was mainly explained by the changed amount of waste from mining and quarrying, but the decrease was also affected by the fallen amount of waste from construction and demolition.
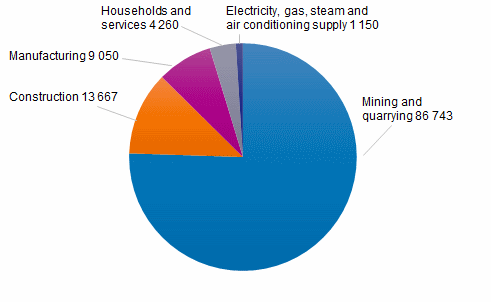
Waste generated by sector and type in 2019, 1,000 tonnes per year

Mineral waste accounted for around 91 per cent of the total amount of waste. In addition to mining and quarrying, mineral waste was generated especially in construction, where the majority of the waste was landfilled surplus soil. The amount of mineral waste generated in construction was 1.8 million tonnes lower than in the year before, in total 13.2 million tonnes.
The total amount of waste in industrial production and energy supply grew from 9.9 to 10.2 million tonnes.
The combined volume of waste generated by services and households grew considerably due to the inaccuracy of statistics, because mineral waste, like soil mass, previously recorded in waste management had to be included in the statistics more generally as being generated by municipal services. For this reason, the volume of waste from services and households rose to 4.3 million tonnes. Without this change in the amount of mineral waste, the amount of waste from services and households would have increased only a little.
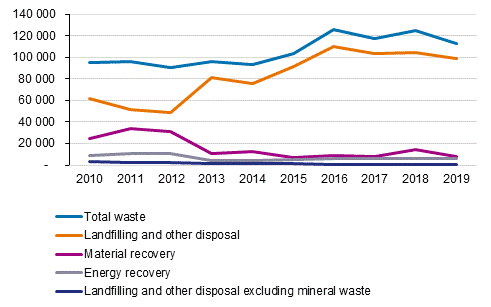
Methods of waste treatment in 2010 to 2019, 1,000 tonnes per year

The amounts of waste treatment were the result of the lower amount of waste. Most of the waste was mineral waste landfilled in mining areas and landfilled soil masses of construction. Due to the lower amount of waste, their material recovery was lower than in previous years, which decreased the share of material recovery, being 7.2 per cent of all treated waste.
Examined without mineral waste, slightly less than earlier, 56 per cent of the waste was recovered as energy. This waste was mainly wood waste and mixed waste, such as household waste. The share of material recovery rose slightly from the year before, from 33.4 to 33.9 per cent. Of other than mineral waste, more waste than before ended up at landfills, 9.2 per cent, which is explained by increased reservoirs and landfilling of various sludges.
Data on imports and exports of waste were now calculated for the first time at Statistics Finland. In 2019, around 1.3 million tonnes of waste were imported and around 0.9 million tonnes exported. Relative to all treated waste, the amounts were around 1.2 and 0.8 per cent.
Source: Waste statistics 2019, Statistics Finland
Inquiries: Juha Espo 029 551 3463, Heidi Pirtonen 029 551 3583, ymparistotilinpito@stat.fi
Head of Department in charge: Katri Kaaja
Publication in pdf-format (229.2 kB)
- Tables
-
Tables in databases
Pick the data you need into tables, view the data as graphs, or download the data for your use.
Appendix tables
Updated 16.6.2021
Official Statistics of Finland (OSF):
Waste statistics [e-publication].
ISSN=2323-5314. 2019. Helsinki: Statistics Finland [referred: 19.4.2025].
Access method: http://stat.fi/til/jate/2019/jate_2019_2021-06-16_tie_001_en.html

