Published: 26 May 2011
Mass media market growing slightly, preliminary data 2010
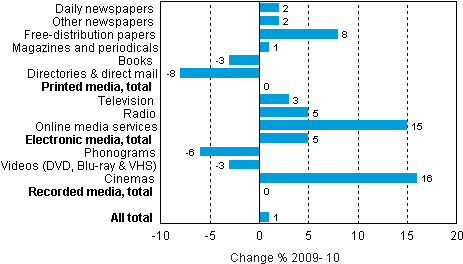
The media market recovered to a gentle growth in 2010 after the exceptionally steep drop in the year before. Overall, the growth amounted to one per cent. The growth clearly centred on electronic media (+5%), although there were other individual growth areas as well.
Of individual media sectors, most grew cinemas (+16%) and online media services (+15%). Printed directories and direct mail developed the most weakly (-8%). Electronic directories are slowly replacing conventional printed directory products.
Changes in mass media markets 2009 - 2010 (%)

The value of the Finnish mass media market was in 2010 around EUR 4.25 billion, which is about EUR 50 million more than in 2009.
The relative share of printed mass media in the value of the mass media market contracted further by around one percentage point to 64 per cent. The share of electronic mass media in the mass media market in turn grew to 29 per cent.
In the last ten years, the share of printed media has fallen in total by ten percentage points, and the share of electronic media has grown by the same amount.
Mass media market volume in Finland 2009 - 2010
| |
2009 | 2010 | 2010 |
| EUR million | EUR million | % | |
| Daily newspapers (7-4 times a week) | 946 | 960 | 23 |
| Other newspapers (3-1 times a week) | 131 | 133 | 3 |
| Free-distribution papers | 81 | 88 | 2 |
| Magazines and periodicals | 700 | 705 | 17 |
| Books* | 570 | 555 | 13 |
| Directories & direct mail | 304 | 280 | 7 |
| Printed media, total | 2 731 | 2 721 | 64 |
| Television** | 944 | 973 | 23 |
| Radio | 52 | 55 | 1 |
| Online media services | 188 | 216 | 5 |
| Electronic media, total | 1 185 | 1 243 | 29 |
| Phonograms | 85 | 80 | 2 |
| Videos (DVD, Blu-ray & VHS) | 145 | 141 | 3 |
| Cinemas | 60 | 69 | 2 |
| Recorded media, total | 290 | 289 | 7 |
| All total | 4 205 | 4 254 | 100 |
| * Also includes the
sales of multimedia recordings (DVD, CD-ROM, etc.) by members of the Finnish Book Publishers Association. ** Also includes YLE public service radio. |
|||
The preliminary calculations presented here describe the mass media market at the end user level: for example, the figure on the newspaper market is comprised of retail priced subscription and single copy sales of newspapers, and their revenue from advertising. Overlaps have been eliminated. The figures cover domestic production and imports but not exports.
Source: Mass media and cultural statistics. Statistics Finland
Inquiries: Tuomo Sauri +358 9 1734 3449, joukkoviestimet.tilastokeskus@stat.fi
Director in charge: Riitta Harala
- Tables
-
Tables in databases
Pick the data you need into tables, view the data as graphs, or download the data for your use.
Last updated 26.5.2011
Official Statistics of Finland (OSF):
Mass media statistics [e-publication].
ISSN=2323-6345. 2010. Helsinki: Statistics Finland [referred: 19.4.2025].
Access method: http://stat.fi/til/jvie/2010/jvie_2010_2011-05-26_tie_001_en.html

