Published: 4 December 2015
Video markets plummeted
The value of the mass media market decreased further to slightly under EUR four billion in 2014. It was around EUR 140 million or three per cent less than in the year before.
Nearly one-fifth of the value of recording markets vanished. The video recording markets declined by around one-third and sound recording sales decreased by 14 per cent. The collapse in the sales of video recordings is probably explained by video on-demand services, like Netflix, rapidly becoming more common.
Mass media market in 2013 to 2014, EUR million
| 2013, EUR mill. | 2014, EUR mill. | 2014, % | Change, 2013-14, % | |
| Daily newspapers (7-4 times a week) 1) | 911 | 874 | 22 | -4 |
| Other newspapers 1) | 132 | 130 | 3 | -2 |
| Free-distribution papers 1) | 73 | 73 | 2 | 0 |
| Magazines and periodicals 1) | 610 | 550 | 14 | -10 |
| Books 1) | 554 | 548 | 14 | -1 |
| Direct mail | 207 | 179 | 5 | -14 |
| Publishing, total | 2 487 | 2 353 | 59 | -5 |
| Television 2) | 1 075 | 1 088 | 27 | 1 |
| Radio | 55 | 60 | 2 | 8 |
| Internet advertising | 239 | 265 | 7 | 11 |
| Electronic media, total | 1 369 | 1 413 | 36 | 3 |
| Phonograms 1) | 67 | 58 | 1 | -14 |
| Videos | 110 | 75 | 2 | -32 |
| Cinemas | 77 | 75 | 2 | -3 |
| Recorded media, total | 255 | 208 | 5 | -19 |
| All total | 4 111 | 3 974 | 100 | -3 |
2) Also includes YLE public service radio.
Electronic media grew by three per cent. The highest relative growth was observed in web advertising, which grew by 11 per cent. The share of electronic media in mass media markets has doubled during this millennium from under one-fifth (18%) to over one-third (36%). Publishing activities went down by five per cent from the year before.
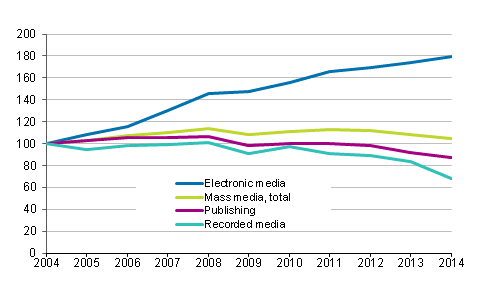
The value of the electronic media market has nearly doubled over the past ten years. The value of publishing activities and of recording markets, in particular, has been declining clearly for several years.
Mass media market development in 2004 to 2014, 2004=100

The calculations presented here describe the mass media market at end user level: for example, the figure on the newspaper market is comprised of retail priced subscription and single copy sales of newspapers, and their revenue from advertising. The figures cover domestic production and imports but not exports. There is some overlap between Internet advertising and other media groups.
Source: Mass media and cultural statistics. Statistics Finland
Inquiries: Tuomo Sauri 029 551 3449, joukkoviestimet.tilastokeskus@stat.fi
Director in charge: Jari Tarkoma
Publication in pdf-format (230.3 kB)
- Tables
-
Tables in databases
Pick the data you need into tables, view the data as graphs, or download the data for your use.
Appendix tables
- Appendix table 1. Sector shares of the mass media market 2000 - 2014 per cent (4.12.2015)
- Appendix table 2. Breakdown of newspaper sales 2000 - 2014, per cent (Corrected on 5 July 2018) (4.12.2015)
- Appendix table 3. Breakdown of magazine sales 2000 - 2014, per cent (4.12.2015)
- Appendix table 4. Radio advertising 2000 - 2014, per cent (4.12.2015)
- Appendix table 5. Television (terrestrial + cable + satellite) revenue 2000 - 2014, per cent (4.12.2015)
Updated 04.12.2015
Official Statistics of Finland (OSF):
Mass media statistics [e-publication].
ISSN=2323-6345. 2014. Helsinki: Statistics Finland [referred: 19.4.2025].
Access method: http://stat.fi/til/jvie/2014/jvie_2014_2015-12-04_tie_001_en.html

