Published: 16 November 2012
Finnish imports of goods heavier than exports
Last year, Finland imported nearly 62 million tonnes of goods. A fifth of the weight of the imported goods was biotic, in particular agricultural and forestry products, refined wood products and food. The import volume of food (2.3 million tonnes) doubled in the past decade, and that of wood products grew even more. However, a majority of imported goods were abiotic, mainly energy minerals, oil products, chemicals, ores and metals. The single largest product groups were crude oil (11.2 million tonnes), coal, gas and iron ore.
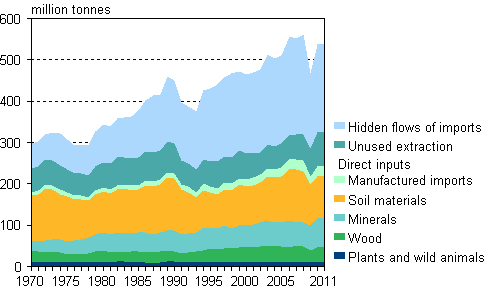
Total material requirement by material groups 1970–2011

Last year, the export volume was 45 million tonnes. The export volume of biotic products was nearly the same as that of abiotic ones. In addition to wood and paper products, the highest volumes were seen in oil products, chemicals, base metals and stone products. The export volumes in the forest industry were clearly lower than during the early years of the millennium. The exports of abiotic products was larger than those of biotic products for the first time in 2009. The degree of refining in exported goods is clearly higher than in imported goods.
Total material requirement in Finland's national economy in 2011 was 540 million tonnes, slightly more than in the previous year. The calculation includes natural resources taken in Finland but not used, as well as indirect material flows abroad related to imported goods, so-called hidden flows. The amount of unused, but extracted natural resources was 80 million tonnes in Finland last year, and the amount of international hidden flows was estimated to be 215 million tonnes. The national economy's direct use of materials was 245 million tonnes.
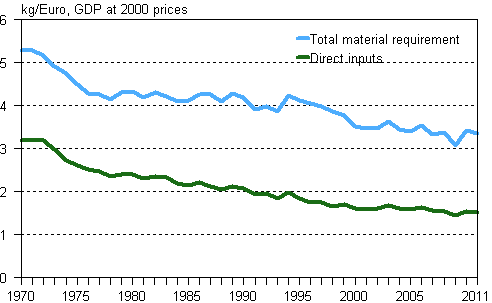
Total material requirement has almost doubled from 1970 to 2011. By international comparison, material requirement as direct input per capita is currently notably high in Finland, 45 tonnes per capita a year, while the EU average is 16 tonnes. Especially the direct input and the hidden flows from imports have grown; the former 2.3-fold and the latter 3.5-fold in 40 years. The material intensity of Finland's economy, or the amount of used material relative to GDP, has, however, shown a decreasing trend and, so far, it has been at its lowest or most efficient in 2009.
Statistics Finland started publishing the Economy-wide material flow accounts last year (2011). The time series of these data (1970-2009) were previously compiled by the Thule Institute of the University of Oulu. The accounts form part of environmental accounts, on which the European Union passed a regulation last year.
Material intensity of Finland's economy 1970-2011

Source: Economy-wide material flow accounts 2011, Statistics Finland
Inquiries: Simo Vahvelainen 09 1734 3457, Leo Kolttola 09 1734 3234, Jukka Muukkonen 09 1734 3224, environmental.accounts@stat.fi
Director in charge: Leena Storgårds
Publication in pdf-format (226.2 kB)
- Tables
-
Tables in databases
Pick the data you need into tables, view the data as graphs, or download the data for your use.
Appendix tables
Updated 16.11.2012
Official Statistics of Finland (OSF):
Economy-wide material flow accounts [e-publication].
ISSN=2242-1289. 2011. Helsinki: Statistics Finland [referred: 19.4.2025].
Access method: http://stat.fi/til/kanma/2011/kanma_2011_2012-11-16_tie_001_en.html

