Published: 16 December 2011
The number of suicides lowest in 40 years
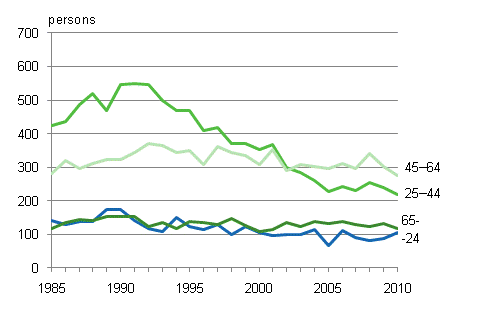
In 2010 the number of suicides was eight per cent lower than in the previous year. The number of suicides has last been lower in 1967. A total of 954 persons, 718 men and 236 women, committed suicide in 2010. The highest numbers of suicides are committed by people of working age and in these age groups suicides have diminished considerably in recent years. Men commit suicides significantly more often than women: two thirds of the suicides are committed by men.
Suicides by age in 1985-2010, men

Altogether 50,910 persons died in 2010. The number was two per cent higher than in the previous year and the highest in 17 years. The longer life expectancy can be seen in the change in the age distribution of deaths: the mortality rate among those aged 80 or over increased from the year before, for younger age groups than this the mortality rate remained more or less unchanged. Increased mortality of aged people is visible in causes of death primarily as the growing number of deaths from dementia and diseases of the circulatory system.
Forty per cent of deaths in 2010 were caused by diseases of the circulatory system. The second highest number of deaths, 22 per cent, was caused by neoplasms. Dementia (inclusive of Alzheimer's disease) caused 12 per cent of deaths in 2010.
In 2010, 1,962 persons died from alcohol-related diseases and alcohol poisonings, that is, five per cent fewer than in the previous year. Seventy-seven per cent of those dying from alcohol-related causes were aged under 65. Deaths from alcohol-related causes follow fairly regularly changes in total alcohol consumption: consumption of alcohol went down by two per cent from the previous year.
Leading causes of death, whole population 2009 and 2010
| 2009 | 2010 | |||||
| Total | Males | Females | Total | Males | Females | |
| Diseases of the circulatory system | 20 235 | 9 744 | 10 491 | 20 475 | 9 900 | 10 575 |
| Neoplasms | 11 310 | 5 953 | 5 357 | 11 879 | 6 239 | 5 640 |
| Dementia, Alzheimer's disease | 5 489 | 1 661 | 3 828 | 6 057 | 1 890 | 4 167 |
| Accidents | 2 433 | 1 597 | 836 | 2 466 | 1 575 | 891 |
| Disease of the respiratory system | 2 210 | 1 333 | 877 | 1 988 | 1 221 | 767 |
| Alcohol related diseases and accidental poisoning by alcohol | 2 065 | 1 651 | 414 | 1 962 | 1 536 | 426 |
| Suicides | 1 034 | 761 | 273 | 954 | 718 | 236 |
| Other causes of death | 5 128 | 2 452 | 2 676 | 5 129 | 2 468 | 2 661 |
| Deaths total | 49 904 | 25 152 | 24 752 | 50 910 | 25 547 | 25 363 |
In Finland statistics on causes of death have been compiled in their present form for 75 years. To honour the anniversary, Statistics Finland has collected time series on causes of death among Finnish residents starting from 1936. During that time, life expectancy has lengthened considerably: the life expectancy of a Finnish man in the 1930s was around 53 years and that of a woman 59 years. The life expectancy is 76.7 years for a boy born in 2010 and 83.2 years for a girl. This is visible in mortality for example in that 11 per cent of those dying in 1936 were aged 85 or over, while in 2010 as many as nearly one half. Causes of death among the Finnish population have changed similarly as in other industrialised countries - as the standard of living has improved and the medical science has advanced, infectious diseases have diminished, but at the same time, diseases of the circulatory system and neoplasms have increased their share in all causes of death.
Source: Causes of death, Statistics Finland
Inquiries: Marja-Liisa Helminen (09) 1734 3273, Helena Korpi (09) 1734 3605, Irmeli Penttilä (09) 1734 3253, kuolemansyyt@stat.fi
Director in charge: Jari Tarkoma
Publication in pdf-format (524.2 kB)
- Reviews
-
- Foreword (16.12.2011)
- 1. Changes in causes of death 1936 to 2010 (16.12.2011)
- 2. Mortality from diseases in 1936 to 2010 (16.12.2011)
- 3. Alcohol-related causes of death in 1969 to 2010 1) (16.12.2011)
- 4. Accident mortality in 1936 to 2010 (16.12.2011)
- 5. Suicide mortality in 1921 to 2010 (16.12.2011)
- 6. Infant mortality in 1936 to 2010 (16.12.2011)
- References (16.12.2011)
- Tables
-
Tables in databases
Pick the data you need into tables, view the data as graphs, or download the data for your use.
Appendix tables
- Appendix table 1a. Deaths by underlying cause of death (54-group classification) and by age in 2010, both sexes (16.12.2011)
- Appendix table 1b. Deaths by underlying cause of death (54-group classification) and by age in 2010, men (16.12.2011)
- Appendix table 1c. Deaths by underlying cause of death (54-group classification) and by age in 2010, women (16.12.2011)
- Appendix table 2. Deaths from accidents by external cause and deaths from alcohol intoxication 2010 (16.12.2011)
- Appendix table 3. Mortality during infant and perinatal period 1987 - 2010 (16.12.2011)
- Appendix table 4. Mean population 2010 by age and gender (16.12.2011)
- Appendix table 5. Standard population used in calculating age-standardised figures (16.12.2011)
- Figures
- Quality descriptions
-
- Quality description of cause of death statistics (16.12.2011)
Updated 16.12.2011
Official Statistics of Finland (OSF):
Causes of death [e-publication].
ISSN=1799-5078. 2010. Helsinki: Statistics Finland [referred: 19.4.2025].
Access method: http://stat.fi/til/ksyyt/2010/ksyyt_2010_2011-12-16_tie_001_en.html

