Municipal elections 2004 - who were the candidates and who were elected?
The majority were men and represented the large age groups
A total of 39,906 candidates were nominated in the municipal elections, which was 160 candidates more than in 2000. The highest numbers of candidates were nominated by the Centre Party (11,164), the Social Democratic Party (8,864), the Coalition Party (7,578) and the Left Alliance (4,280). Over 1,500 candidates were nominated by the Green League (1,836), the Swedish People's Party (1,493) and the Christian Democrats (1,727), while True Finns had 881 candidates and the Communist Party of Finland 325. For reasons of data protection, the candidates of small parties cannot be examined separately.
The majority, or 51.6 per cent, of the persons entitled to vote are women. Women make up 39.9 per cent of the candidates. The proportion of female candidates has risen by nearly 2 percentage points from the previous elections. Only the Green League has more female than male candidates (52.9 per cent). The Christian Democrats come next closest to a balanced situation with a 47.3 per cent proportion of female candidates. The proportion of women is around 40 per cent in the Coalition Party, the Centre Party and the Social Democratic Party. The percentage of female candidates is the highest in the region of Uusimaa, at 43.5 per cent, and the lowest in Lapland, at 37.0 per cent. Women make up 36.3 per cent of the elected councillors, which is 1.9 percentage points up from the previous elections.
Women's and men's proportions of persons entitled to vote, candidates and elected councillors in Municipal elections 2004
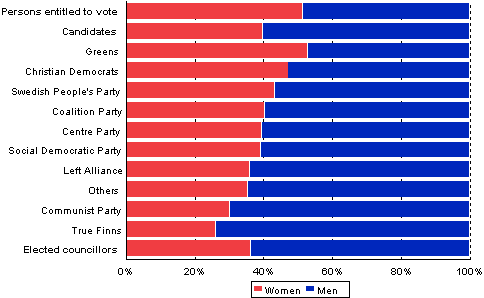
Women's and men's proportions of persons entitled to vote, candidates and elected councillors in Municipal elections 2004
| Women | Men | |
| Persons entitled to vote | 51.6 | 48.4 |
| Candidates | 39.9 | 60.1 |
| Greens | 52.9 | 47.1 |
| Christian Democrats | 47.3 | 52.7 |
| Swedish People's Party | 43.5 | 56.5 |
| Coalition Party | 40.4 | 59.6 |
| Centre Party | 39.7 | 60.3 |
| Social Democratic Party | 39.2 | 60.8 |
| Left Alliance | 36.1 | 63.9 |
| Others | 35.4 | 64.6 |
| Communist Party | 30.2 | 69.8 |
| True Finns | 26.3 | 73.7 |
| Elected councillors | 36.3 | 63.7 |
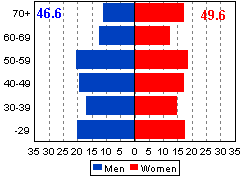
Age distribution of persons entitled to vote by gender in Municipal elections 2004
| Persons entitled to vote | Candidates |
 |
 |
The average age of persons entitled to vote is 48.3 years and that of candidates 46.7 years. Female candidates are, on average, 4.6 years younger than female voters, whereas male candidates are 1.3 years older than male voters. The number of male candidates is the highest in the 50 to 59-year-old age group, and that of female candidates in the 40 to 49-year-old age group. The number of representatives of the large age groups among the candidates clearly exceeds their proportion of the whole population. The numbers of candidates from the over 70-year-old and under 40-year-old age groups are lower than their proportion of the whole population.
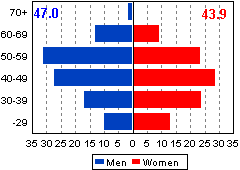
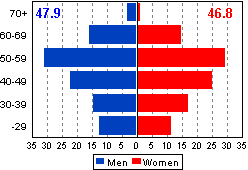
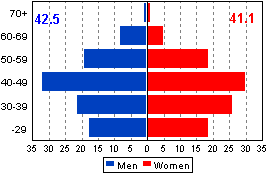
The differences by party are fairly small: the average age of female candidates is 2 to 3 years lower than that of male candidates, with the exception of the Greens. The most male candidates represent the 50 to 59-year-old age group and the most female candidates the 40 to 49-year-old age group. The Social Democrat and the Christian Democrat candidates have the highest average age. The candidates of the Coalition Party and the Swedish People's Party are slightly younger. The Centre Party's candidates are, on average, somewhat younger than those of the Coalition Party and the Social Democratic Party. The Greens have the youngest candidates: the average age for men is 42.5 years and that for women 41.1. Indeed, the Greens have relatively the most candidates under 40 years of age and the least candidates over 60 years of age.
Age differences by region vary according to party. The Social Democratic Party has the oldest candidates in Kainuu and the youngest in Satakunta, while the Centre Party has the oldest candidates in Lapland and the youngest in Itä-Uusimaa. The Greens' oldest candidates are in Savo and the youngest in Central Ostrobothnia.
The Greens have relatively the highest number of candidates aged 30 to 39 and 20 to 29 and the lowest number of candidates aged 60 or over.
Proportions of male and female candidates by party in Municipal elections 2004
| Social Democratic Party | Centre Party |
 |
 |
| Coalition Party | Christian Democrats |
 |
 |
| Greens | Swedish People's Party |
 |
 |
Age distribution of candidates and elected councillors by gender in Municipal elections 2004
| Candidates | Elected councillors |
 |
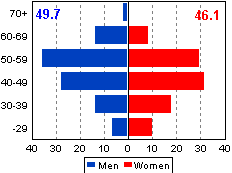 |
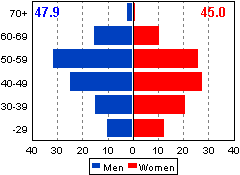
The average age of elected male councillors is 49.7 years and that of elected female councillors 46.1 years. Both are roughly one year higher than the average ages of candidates. The elected male councillors are, on average, 1.2 years older than their counterparts in the previous election, while the corresponding figure for elected female councillors is 0.6 years. Especially 50 to 50-year-old men had a strong representation among the elected councillors. The proportion of elected under 30-year-old male councillors was clearly lower than their proportion of candidates. The age distribution of elected female councillors was closer to that of the female candidates. Women aged 40 to 49 were elected the most, and they also made up most of the candidates.
Educational level of candidates high
The candidates differ clearly by their education from all persons entitled to vote. Of the candidates 79.5 per cent have attained a higher educational level than the basic level, while 62.6 per cent of all persons entitled to vote have some post basic level education. The Greens have the highest proportion, at 28.4 per cent, of candidates with academic degrees. The corresponding figure is 22.8 per cent for the Swedish People's Party, 19.1 per cent for the Coalition Party and 15.2 per cent for the Christian Democrats. The Social Democrats differ from the other parties in that only 7.2 per cent of its candidates have an academic degree. For the Greens the figure is nearly four times as high. In the Municipal elections, the educational level of the candidates reflects the differences in the educational structure of the areas. The proportion of the highly educated is usually double in Uusimaa when compared with the least educated areas.
Persons entitled to vote, candidates and elected councillors by level of education in Municipal elections 2004

Persons entitled to vote, candidates and elected councillors by level of education in Municipal elections 2004
| Higher-degree level tertiary education | Lowest level of tertiary education | Upper secondary level education | Basic level | |
| Persons entitled to vote | 6.6 | 18.2 | 37.8 | 37.4 |
| Candidates | 11.9 | 27.9 | 39.7 | 20.5 |
| Greens | 28.4 | 28.2 | 32.8 | 10.5 |
| Swedish People's Party | 22.8 | 34.0 | 28.3 | 14.9 |
| Coalition Party | 19.1 | 38.9 | 29.0 | 13.0 |
| Christian Democrats | 15.2 | 28.8 | 38.0 | 18.0 |
| Others | 10.9 | 27.0 | 37.8 | 24.3 |
| Centre Party | 10.0 | 31.0 | 41.2 | 17.8 |
| Social Democratic Party | 7.2 | 22.4 | 45.0 | 25.4 |
| Communist Party | 5.9 | 13.9 | 44.6 | 35.7 |
| Left Alliance | 4.5 | 13.5 | 50.8 | 31.2 |
| True Finns | 2.6 | 13.5 | 45.4 | 38.5 |
| ELECTED COUNCILLORS | 15.1 | 31.7 | 35.8 | 17.4 |
The educational level of elected councillors is clearly higher than that of the candidates; 46.8 per cent of the elected councillors hold tertiary level qualifications and only 17.4 per cent have no vocational education.
Family situation in order
Only one-third of the persons entitled to vote live in the same household with their married spouse and children. Of the candidates 47.7 per cent live in such families. In addition, 18.9 per cent live together with just their spouse. The proportion of candidates living in married families has fallen by three percentage points from the previous elections. The proportion of those cohabiting has risen by two percentage points into 11.8 per cent. Single parents make up 7.1 per cent of the candidates. Singles, i.e. persons not belonging to families, make up 14.5 per cent.
Persons entitled to vote, candidates and elected councillors by family type in Municipal elections 2004

Persons entitled to vote, candidates and elected councillors by family type in Municipal elections 2004
| Married with children | Married, no children | Single parent with children | Cohabiting couple | No family | |
| Persons entitled to vote | 32.0 | 20.8 | 7.5 | 13.7 | 26.1 |
| Candidates | 47.7 | 18.9 | 7.1 | 11.8 | 14.5 |
| Centre Party | 58.1 | 16.1 | 6.4 | 9.6 | 9.9 |
| Christian Democrats | 55.2 | 21.4 | 5.9 | 3.3 | 14.3 |
| Swedish People's Party | 53.2 | 17.2 | 6.6 | 11.8 | 11.3 |
| Coalition Party | 50.8 | 19.3 | 5.6 | 10.4 | 13.9 |
| Others | 42.4 | 18.1 | 8.8 | 12.5 | 18.3 |
| Social Democratic Party | 41.0 | 22.9 | 7.7 | 13.5 | 14.9 |
| Greens | 40.3 | 9.4 | 10.5 | 17.4 | 22.4 |
| True Finns | 38.3 | 16.4 | 9.0 | 13.3 | 23.2 |
| Left Alliance | 33.8 | 22.1 | 8.1 | 16.3 | 19.8 |
| Communist Party | 19.1 | 20.3 | 12.0 | 16.0 | 32.6 |
| ELECTED COUNCILLORS | 56.4 | 20.6 | 5.0 | 9.0 | 9.1 |
Although the average age of the candidates is close to 50, surprisingly many still have children living at home. The percentages of married candidates living together with their spouse and children are 58.1 per cent for the Centre Party, 55.2 per cent for the Christian Democrats, 53.2 per cent for the Swedish People's Party, 50.8 per cent for the Coalition Party and 41 per cent for the Social Democrats. The proportion of candidates living in families with children has fallen by 3-4 percentage points from the previous elections, because the age structure of the candidates has become older. Cohabiting is the most common for the candidates of the Green League, the Left Alliance and the Communist Party, of whom about 16 to 17 per cent cohabit. The number of candidates not belonging to families was highest in the Communist Party.
Of the elected councillors 56.4 per cent live in families with both spouses and underage children. Married couples without children make up 20.6 per cent. Only 9.1 per cent of elected councillors do not belong to a family. The proportion of those cohabiting is 9 per cent and that of single parents 5 per cent.
Persons entitled to vote, candidates and elected councillors by number of biological children in Municipal elections 2004

Persons entitled to vote, candidates and elected councillors by number of biological children in Municipal elections 2004
| 1 child | 2 children | 3 children | 4+ children | No children | |
| Persons entitled to vote | 16.2 | 27.3 | 13.9 | 7.7 | 35.0 |
| Candidates | 13.5 | 31.4 | 21.5 | 12.7 | 20.9 |
| Social Democrats | 16.1 | 34.7 | 20.9 | 10.3 | 18.1 |
| Centre Party | 11.1 | 29.3 | 23.7 | 16.4 | 19.6 |
| Left Alliance | 15.9 | 31.9 | 19.7 | 11.3 | 21.2 |
| Others | 14.3 | 31.6 | 20.9 | 11.9 | 21.3 |
| Coalition Party | 13.1 | 34.0 | 21.5 | 9.9 | 21.5 |
| Christian Democrats | 9.6 | 23.3 | 22.3 | 22.6 | 22.3 |
| Swedish People's Party | 12.2 | 32.4 | 22.2 | 10.3 | 23.0 |
| True Finns | 13.7 | 23.8 | 20.4 | 16.1 | 25.9 |
| Greens | 15.3 | 28.2 | 16.4 | 8.2 | 31.9 |
| Communist Party | 16.6 | 21.9 | 16.3 | 11.1 | 34.2 |
| ELECTED COUNCILLORS | 11.7 | 33.9 | 25.2 | 15.1 | 14.2 |
Family type does not reveal how many of the candidates have had children of their own, because in older families, in case of divorce, etc., children can live apart from the candidates. The number of biological children tells how many candidates have experience of their own children. Of all persons entitled to vote, 35 per cent do not have children of their own, while this is the case for 20.9 per cent of the candidates. The number of childless candidates varies from 18.1 per cent for the Social Democrats to 34.2 per cent for the Communist Party. The Greens (of whom 31.9 per cent are childless) have several young candidates, who may not have had children yet. Large families are the most numerous among Christian Democrat and Centre Party candidates. Of the Christian Democrat candidates 22.6 per cent have at least four children and of the Centre Party candidates 16.4 per cent have four or more children. Large families are rarer among the Green League and Coalition Party candidates. The candidates' number of children reflects the birth rate in the area, which means that the number of large families is highest in Ostrobothnia and Kainuu and the smallest families are found along the south coast in Varsinais-Suomi, Uusimaa, Kymenlaakso and South Karelia.
Of the candidates 79.1 per cent have biological children, whereas the corresponding percentage among persons entitled to vote is only 65.0. The proportion of childless candidates has grown by four percentage points from the previous Municipal elections.
Of elected councillors 85.8 per cent have biological children, 15.1 per cent have more than three biological children and only 14.2 per cent have no biological children.
Employment problems rare
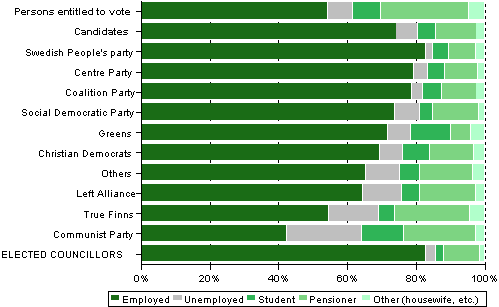
Over one-half of those entitled to vote are employed (54.3%), 7.3 per cent are unemployed, 25.8 per cent are pensioners and 12.6 per cent are students or engaged in domestic work. The proportion of the employed has risen and that of the unemployed has fallen by a couple of percentage points from the previous elections. Clearly more of the candidates, at 74.4 per cent, are employed, slightly fewer, or 6.2 per cent, are unemployed and clearly fewer, or just 11.7 per cent, are pensioners. There are, however, more pensioners among the candidates than in the previous elections (the increase amounts to 3 percentage points).
Persons entitled to vote, candidates and elected councillors by main type of activity in Municipal elections 2004
Candidates by main type of activity by party in Municipal elections 2004
| Employed | Unemployed | Student | Pensioner | Other (housewife, etc.) | |
| Persons entitled to vote | 54.3 | 7.3 | 8.1 | 25.8 | 4.5 |
| Candidates | 74.4 | 6.2 | 5.4 | 11.7 | 2.4 |
| Swedish People's party | 82.9 | 1.9 | 4.8 | 7.9 | 2.4 |
| Centre Party | 79.3 | 4.2 | 4.9 | 9.4 | 2.1 |
| Coalition Party | 78.9 | 3.1 | 5.6 | 10.0 | 2.4 |
| Social Democratic Party | 73.9 | 7.3 | 3.8 | 13.4 | 1.7 |
| Greens | 72.0 | 6.5 | 11.8 | 5.8 | 4.0 |
| Christian Democrats | 69.6 | 6.6 | 7.8 | 12.8 | 3.2 |
| Others | 65.6 | 9.7 | 5.9 | 15.4 | 3.5 |
| Left Alliance | 64.7 | 11.1 | 5.3 | 16.4 | 2.5 |
| True Finns | 54.7 | 14.6 | 4.5 | 21.7 | 4.4 |
| Communist Party | 42.5 | 21.9 | 12.3 | 20.9 | 2.5 |
| ELECTED COUNCILLORS | 82.9 | 3.0 | 2.3 | 10.6 | 1.3 |
The numbers of employed candidates were the highest in the Swedish People's Party (82.9 per cent), the Centre Party (79.3 per cent) and the Coalition Party (78.9 per cent), all of which clearly exceed the Government's 75 per cent employment objective. In these parties also unemployment is rarer than average. The candidates of the Social Democratic Party, the Greens and the Christian Democrats have been affected by unemployment as often as the persons entitled to vote, whereas the candidates of the Communist Party, the True Finns and the Left Alliance have been have been unemployed more often than average. The Greens and the Communist Party have the highest relative numbers of student candidates (11.8 and 12.3 per cent, respectively). The proportion of pensioner candidates is highest among the True Finns and the Communist Party.
Of the elected councillors 82.9 per cent are employed, only 3 per cent are unemployed, 2.3 per cent are students and 10.6 per cent are pensioners. Of those entitled to vote 7.3 per cent are unemployed, which is two-and-a-half times more than of the elected councillors. The relative proportion of pensioners is also nearly two-and-a-half times higher among persons entitled to vote than among the elected councillors, and that of students is nearly four-fold.
In the region of Uusimaa the candidates' employment rate differs the least from that of their voters, the difference being just 14 percentage points. The difference between the candidates and voters is largest in South Savo, South Ostrobothnia and South Karelia, where the difference in the employment rate is about 26 percentage points. In South Ostrobothnia the candidates' employment rate is even better than in Uusimaa. The employment rate of elected councillors is clearly higher than that of candidates in all regions, and it is not under 75 per cent in any of the regions.
Employment rate of persons entitled to vote and candidates by region in Municipal elections 2004

Employment rate of persons entitled to vote and candidates by region in Municipal elections 2004
| Persons entitled to vote | Candidates | Elected councillors | |
| Uusimaa | 62.1 | 75.7 | 83.0 |
| Itä-Uusimaa | 60.6 | 81.7 | 85.3 |
| Ostrobothnia | 55.4 | 78.1 | 85.5 |
| Varsinais-Suomi | 54.9 | 78.2 | 86.3 |
| Kanta-Häme | 54.3 | 78.2 | 84.6 |
| Pirkanmaa | 53.8 | 72.6 | 83.5 |
| Central Ostrobothnia | 53.3 | 76.7 | 81.6 |
| North Ostrobothnia | 52.7 | 74.0 | 82.9 |
| Päijät-Häme | 52.6 | 73.5 | 82.6 |
| South Orstobothnia | 51.5 | 78.0 | 87.3 |
| Kymenlaakso | 50.6 | 75.0 | 82.8 |
| Central Finland | 50.6 | 70.2 | 80.4 |
| Satakunta | 50.5 | 75.1 | 83.2 |
| South Karelia | 49.0 | 74.8 | 83.6 |
| Pohjois-Savo | 48.8 | 69.3 | 79.8 |
| Etelä-Savo | 47.5 | 74.0 | 82.5 |
| Lapland | 47.1 | 69.2 | 76.4 |
| North Karelia | 46.3 | 69.9 | 80.5 |
| Kainuu | 44.0 | 63.0 | 78.7 |
Income higher than that of voters
The candidates are better educated and more often employed than voters in the area concerned. This partly explains why their average taxable income is generally much higher than that of persons entitled to vote. In the 2002 taxation the average income of persons entitled to vote was EUR 20,200, and that of candidates was EUR 29,500. Both the persons entitled to vote and the candidates had the highest income in the region of Uusimaa. The income differential between the candidates and the persons entitled to vote is at its highest in Kymenlaakso (EUR 9,700) and at its lowest in Central Finland (EUR 6,300).
The candidates' income varies by party from EUR 34,600 of the Coalition Party to EUR 17,100 of the Communist Party. The average income of the Centre Party and Social Democrat candidates is EUR 10,000 lower than that of the Coalition Party and Swedish People's Party candidates. The income of the Greens' younger and often student candidates is, on average, EUR 3,500 higher than that of the persons entitled to vote.
Average income (EUR) of persons entitled to vote, candidates and elected councillors by region in Municipal elections 2004
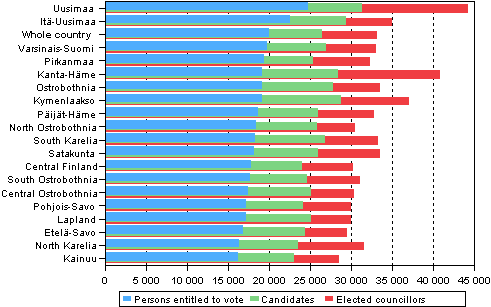
Average income (EUR) of persons entitled to vote, candidates and elected councillors by region in Municipal elections 2004
| Persons entitled to vote | Candidates | Elected councillors | |
| Uusimaa | 24,877 | 31,484 | 44,424 |
| Itä-Uusimaa | 22,661 | 29,522 | 35,068 |
| Whole country | 20,185 | 26,578 | 33,251 |
| Varsinais-Suomi | 19,940 | 27,111 | 33,133 |
| Pirkanmaa | 19,471 | 25,514 | 32,379 |
| Kanta-Häme | 19,282 | 28,508 | 40,983 |
| Ostrobothnia | 19,274 | 27,956 | 33,593 |
| Kymenlaakso | 19,230 | 28,918 | 37,231 |
| Päijät-Häme | 18,761 | 26,040 | 32,875 |
| North Ostrobothnia | 18,569 | 25,918 | 30,564 |
| South Karelia | 18,388 | 26,892 | 33,345 |
| Satakunta | 18,291 | 26,093 | 33,674 |
| Central Finland | 17,904 | 24,203 | 30,321 |
| South Ostrobothnia | 17,825 | 24,781 | 31,171 |
| Central Ostrobothnia | 17,623 | 25,252 | 30,450 |
| Pohjois-Savo | 17,377 | 24,242 | 30,099 |
| Lapland | 17,330 | 25,287 | 30,159 |
| Etelä-Savo | 16,916 | 24,469 | 29,658 |
| North Karelia | 16,421 | 23,674 | 31,639 |
| Kainuu | 16,318 | 23,162 | 28,660 |
The average incomes of the candidates and voters are closest to one another in Uusimaa, where the difference is just 27 per cent and the farthest apart in Kymenlaakso, where the average income of the candidates is 50 per cent higher than that of the voters in the region. In other regions the difference varies between 30 and 48 per cent.
The elected councillors' average incomes are also at the top of their regions. The differences between candidates and the persons entitled to vote are the biggest in Uusimaa, Kanta-Häme and Kymenlaakso. The average income of elected councillors in Kanta-Häme is more than double than that of the persons entitled to vote.
Candidates' average income by party compared to average income of persons entitled to vote by region in Municipal elections 2004
| Persons entitled to vote | Candidates | KESK | SDP | KOK | LEFT | GREENS | KD | RKP | |
| Uusimaa | 100.0 | 126.6 | 120.6 | 119.2 | 169.6 | 98.0 | 104.5 | 106.0 | 160.6 |
| Varsinais-Suomi | 100.0 | 136.0 | 124.3 | 130.7 | 177.6 | 109.9 | 114.2 | 127.5 | 144.8 |
| Satakunta | 100.0 | 142.7 | 139.6 | 138.3 | 178.1 | 116.8 | 112.7 | 130.9 | - |
| Kanta-Häme | 100.0 | 147.9 | 124.4 | 130.4 | 213.2 | 118.2 | 143.4 | 107.2 | - |
| Pirkanmaa | 100.0 | 131.0 | 125.0 | 127.9 | 166.6 | 112.6 | 111.6 | 122.0 | - |
| Päijät-Häme | 100.0 | 138.8 | 136.0 | 124.7 | 169.3 | 119.1 | 128.9 | 125.8 | - |
| Kymenlaakso | 100.0 | 150.4 | 129.9 | 144.3 | 203.4 | 101.6 | 120.7 | 121.1 | 184.1 |
| South Karelia | 100.0 | 146.3 | 138.5 | 145.8 | 167.6 | 151.3 | 121.6 | 143.6 | - |
| Etelä-Savo | 100.0 | 144.7 | 146.9 | 138.4 | 182.5 | 96.6 | 146.6 | 109.8 | - |
| Pohjois-Savo | 100.0 | 139.5 | 147.2 | 143.5 | 186.6 | 116.2 | 108.4 | 120.9 | - |
| North Karelia | 100.0 | 144.2 | 151.1 | 133.8 | 179.1 | 112.8 | 122.5 | 107.6 | - |
| Central Finland | 100.0 | 135.2 | 135.8 | 133.1 | 166.1 | 121.7 | 111.0 | 121.7 | - |
| South Ostrobothnia | 100.0 | 139.0 | 145.9 | 127.9 | 161.8 | 108.9 | 115.6 | 109.9 | - |
| Ostrobothnia | 100.0 | 145.1 | 128.5 | 138.7 | 173.9 | 128.8 | 139.2 | 118.2 | 161.6 |
| Central Ostrobothnia | 100.0 | 143.3 | 151.5 | 121.5 | 168.8 | 119.5 | 98.0 | 136.4 | 186.1 |
| North Ostrobothnia | 100.0 | 139.6 | 138.2 | 134.1 | 190.8 | 123.8 | 123.5 | 136.0 | - |
| Kainuu | 100.0 | 141.9 | 148.3 | 140.2 | 202.1 | 117.3 | 128.7 | 125.1 | - |
| Lapland | 100.0 | 145.9 | 149.0 | 150.9 | 179.2 | 125.5 | 142.5 | 125.1 | - |
| Itä-Uusimaa | 100.0 | 130.3 | 116.1 | 123.4 | 164.8 | 113.5 | 99.8 | 126.5 | 138.4 |
The Coalition Party candidates differ most from the voters in their area: the difference is the biggest in Kanta-Häme, where the candidates' average income is 2.1 times that of the voters. Coalition Party candidates' annual income is double than that of the voters also in Kymenlaakso, Kainuu and North Ostrobothnia.
The Social Democratic Party differs the most clearly from the voters in Lapland, where the difference is 51 per cent, and the least in Uusimaa, where it is 19 per cent. The Centre Party candidates have the largest difference, at 52 per cent, in Central Ostrobothnia and the smallest, at 16 per cent, in Itä-Uusimaa. At its highest the annual income of the Left Alliance and Green League candidates also exceeds the income of voters by 35 to 50 per cent. In some regions the income of these parties' candidates is, however, even lower than average for the region. This is the case for the Left Alliance in Etelä-Savo and Uusimaa and for the Greens in Central Ostrobothnia and Itä-Uusimaa. The average income of the Swedish People's Party candidates was 40 to 80 per cent higher than those of the voters, on average.
The average income of elected councillors was EUR 33,251. The Coalition Party councillors earn the most (EUR 46,952) followed by the Swedish People's Party councillors (EUR 38,878). The average annual income of the Social Democrat, Green League and Christian Democrat councillors ranges from EUR 29,761 to EUR 30,724. The average income of Left Alliance councillors was EUR 27,034. In all parties the average income of the elected councillors is clearly higher than that of candidates.
Persons entitled to vote, candidates and elected councillors by income bracket in Municipal elections 2004
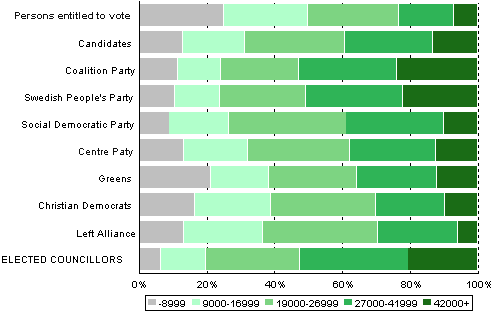
Persons entitled to vote, candidates and elected councillors by income bracket in Municipal elections 2004
| -8,999 | 9,000 - 16,999 | 19,000 - 26,999 | 27,000 - 41,999 | 42,000+ | |
| Persons entitled to vote | 25.0 | 24.9 | 26.7 | 16.1 | 7.2 |
| Candidates | 13.1 | 18.2 | 29.6 | 26.0 | 13.2 |
| Coalition Party | 11.7 | 12.5 | 23.0 | 29.1 | 23.8 |
| Swedish People's Party | 10.6 | 13.3 | 25.3 | 28.8 | 22.0 |
| Social Democratic Party | 9.1 | 17.6 | 34.6 | 28.9 | 9.9 |
| Centre Paty | 13.5 | 18.6 | 30.2 | 25.4 | 12.3 |
| Greens | 21.2 | 17.3 | 26.0 | 23.4 | 12.2 |
| Christian Democrats | 16.7 | 22.3 | 31.0 | 20.3 | 9.7 |
| Left Alliance | 13.3 | 23.4 | 33.8 | 23.8 | 5.8 |
| ELECTED COUNCILLORS | 6.6 | 13.2 | 27.7 | 32.0 | 20.5 |
Among the voters 23.3 per cent earn more than EUR 27,000. One-half of the Coalition Party and Swedish People's Party candidates exceed the EUR 27,000 threshold, and the corresponding figure for the Social Democrat candidates is 38.8 per cent, for the Centre Party candidates 37.7 per cent, for the Green League candidates 35.6, for the Christian Democrat candidates 30.0 per cent and for the Left Alliance candidates 29.6 per cent.
Of the elected councillors 20.5 per cent belong to the income bracket of those earning over EUR 42,000 and the income of 52.5 per cent exceeds EUR 27,500. Only 19.8 per cent earn less than EUR 17,000.
Last updated 12.10.2012
Official Statistics of Finland (OSF):
Municipal elections [e-publication].
ISSN=2323-1114. 2004,
Municipal elections 2004 - who were the candidates and who were elected?
. Helsinki: Statistics Finland [referred: 26.4.2025].
Access method: http://stat.fi/til/kvaa/2004/kvaa_2004_2004-11-11_kat_005_en.html

