Published: 21 April 2017
Confirmed election result: Coalition Party the largest political party, Green League the biggest winner in Municipal elections 2017
The National Coalition Party retained its position as the largest
party in the Municipal elections. The Coalition Party gained
20.7 per cent of the votes, which is
1.2 percentage points down from the previous Municipal
elections. The Coalition Party received a total of
531,599 votes, which is 14,291 down from 2012. The number of
elected Coalition Party councillors declined by
245 councillors. The Green League gained
12.5 per cent of votes, the party's support increased by
3.9 percentage points, by 107,135 votes in total.
The data are based on Statistics Finland's statistics on the
Municipal elections 2017.
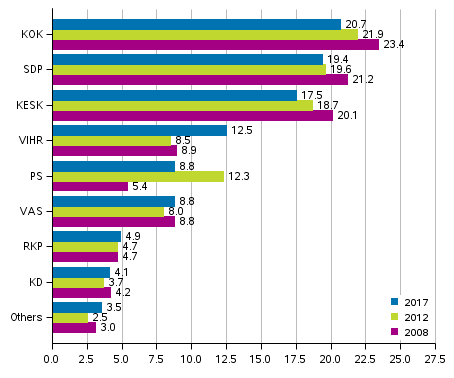
Support for the parties in Municipal elections 2008, 2012 and 2017, %
Others in 2017: Communist Party of Finland (SKP), Communist Worker’s Party (Finland) – For Peace and Socialism (KTP),
Independence Party (IP), Pirate Party, Liberal Party – Freedom for Choice (LIBE), Animal Justice Party of Finland (EOP),, Feminist Party and Constituency associations
Others in 2012: Communist Party of Finland (SKP), Pirate Party, Independence Party (IP), Communist Worker's Party (KTP), Change 2011, Finnish Labour Party (STP), For the Poor (KA), Liberty Party (Liberty Pty) and Constituency associations
Others in 2008: Communist Party of Finland (SKP), Independence Party (IP), Communist Worker's Party (KTP), Finnish Labour Party (STP), Finnish Seniors' Party (SSP), For the Poor (KA) and Constituency associations
The Social Democratic Party retained its position as the second largest party. The party received 498,252 votes, or 19.4 per cent of votes cast. The support for the party decreased by 0.2 percentage points, but the number of votes grew by 10,328. The Centre Party of Finland also retained its position and was the third largest party in the elections. The party received 450,529 votes (17.5 per cent of votes cast), which is 1.2 percentage points and 14,638 votes fewer than in the previous Municipal elections.
The biggest winner in the elections was the Green League that gained 12.5 per cent of the votes and became the fourth largest party in the Municipal elections. The party’s share of the votes cast increased by 3.9 percentage points and the number of votes by 107,135. The party increased its number of councillors by 211.
The Left Alliance’s share of the votes was 8.8 per cent, which was 0.8 percentage points higher than in the previous elections, the party's number of votes increased by 27,011 votes. In relative terms, the Finns Party lost most votes. The party received 8.8 per cent of votes cast, which is 3.5 percentage points and 80,501 votes fewer than in the previous elections. The Swedish People's Party’s share of votes cast was 4.9 per cent, which grew by 0.2 percentage points. The Christian Democrats gained 4.1 per cent of votes, 0.4 percentage points more than in 2012.
Voting turnout on level with previous Municipal elections
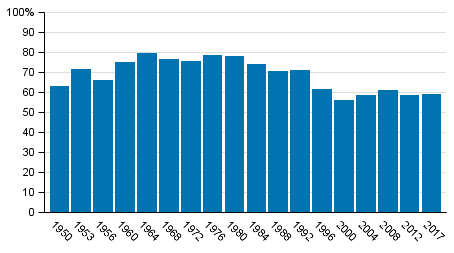
The voting turnout in the Municipal elections 2017 was 58.9 per cent, which is 0.6 percentage points more than in 2012. Voting turnout increased most in the constituency of Helsinki, where the voting percentage increased by 4.4 percentage points from the previous elections. The voting turnout also increased in the constituencies of Varsinais-Suomi, Pirkanmaa, Uusimaa, Vaasa, Häme and Oulu. The voting turnout was highest in the constituency of Vaasa, where 63.8 per cent of persons entitled to vote cast their vote. The voting turnout was also higher than average in the constituencies of Helsinki (61.8%), Varsinais-Suomi (60.1%), Pirkanmaa (60.1%) and Satakunta (59.9%). The lowest voting percentage among the constituencies was found in Savo-Karjala, where 54.8 per cent of persons entitled to vote cast their vote.
Voting turnout in Finland in Municipal elections 1950 to 2017, %
Party Analysis
The party analysis examines parties’ results in the Municipal elections 2017 with the help of various background variables in classified areas. The changes in parties’ support are compared with the results of the previous elections. The voting districts, whose borders have changed as little as possible since the previous elections are used as data. Small voting districts with less than 1,000 persons entitled to vote are combined so that the average size of a voting district is about 2,000 persons entitled to vote. The analysis is based on around 1,400 areas comparable to the previous elections.
The background variables used in the analysis are the area’s industrial structure, degree of urbanisation, income level, unemployment rate and the number of children and pensioners. For example, in areas with high unemployment, the unemployment rate is higher than the country’s average rate. The background variables used are not mutually exclusive. For example, the area’s industrial structure and degree of urbanisation also partially describe the area’s income level. (See methodological description.)
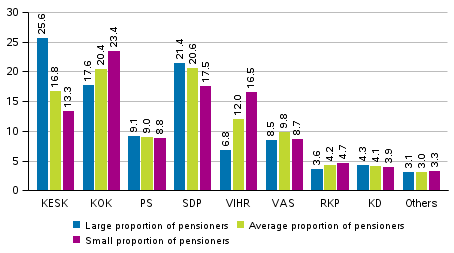
Support for the Green League that won the elections was clearly higher in relative terms in areas where the share of pensioners in the population is low. Support for the Coalition Party was also larger in areas where there is fewer pensioners than on average. By contrast, support for the Centre Party was clearly higher in areas with a large share of pensioners. Support for the Social Democratic Party was also slightly higher in areas with a larger share of pensioners, even though the differences is support between areas was smaller than for the Centre Party. The number of pensioners in different areas do not seem to have much effect on the support for true Finns Party.
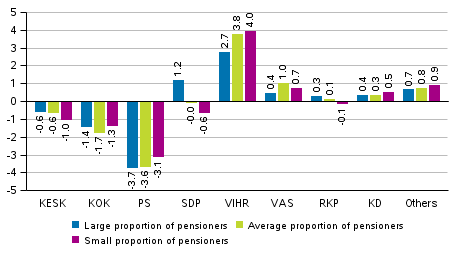
The Centre Party lost support relatively evenly in various areas regardless of the number of pensioners. The changes in support for the Coalition Party were also relatively small. The Social Democratic Party increased its support in areas where the share of pensioners is high. By contrast, the party lost support in other areas. The Finns Party lost least support in areas where the share of pensioners is lower than average.
Support for the parties in the Municipal elections 2017 by the number of pensioners in specific geographical regions, %
Change in the support for the parties in the Municipal elections 2017 by the number of pensioners in specific geographical regions, %
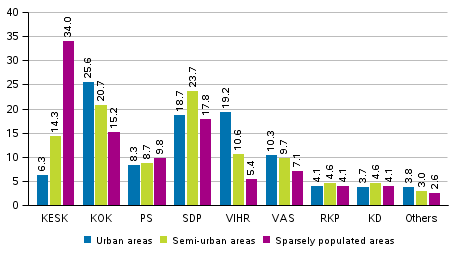
Support for the Centre Party, and in a more limited extent also the Finns Party, focused on sparsely populated areas. The support profile for the Coalition Party and the Green League was almost the opposite examined with this indicator, their support was largest in urban areas. The Social Democratic Party’s support was divergent when examined with this indicator, the biggest support was reached in population centres that are less populated than urban areas.
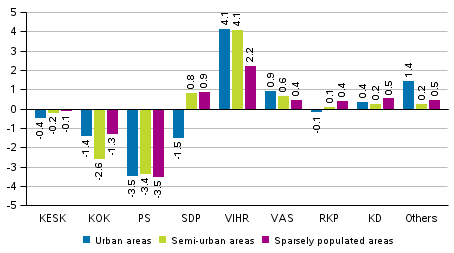
The Centre Party lost support quite evenly in variously populated areas in the 2017 elections. The Coalition Party’s support decreased most in population centres, while that of the True Finns decreased evenly in various settlement areas. The Social Democratic Party, in turn, lost support in urban areas but managed to increase its support in less populated areas. Support for the Green League increased in all areas, most in urban areas and in population centres.
Support for the parties in the Municipal elections 2017 by areas specified by population density, %
Change in the support for the parties in the Municipal elections 2017 by areas specified by population density, %
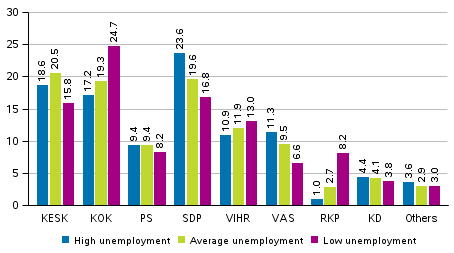
In areas of high unemployment, the Social Democratic Party and the Left Alliance gained higher support than on average. The situation was the opposite for the Coalition Party and the Green League, support was higher in areas with lower unemployment. By contrast, the support for the Finns Party was, on average, lower in areas with low unemployment.
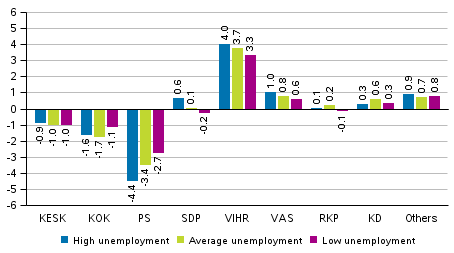
The Centre Party and the Coalition Party lost support in all areas measured by unemployment; the Centre Party evenly in all areas and the Coalition Party especially in areas with high or average levels of unemployment. The Green League and the Left Alliance increased their support everywhere but most in areas of high unemployment. The Social Democratic Party mainly improved its support in areas with high unemployment. Support for the True Finns declined in all areas measured by unemployment but particularly in areas where the unemployment rate is higher than average.
Support for the parties in the Municipal elections 2017 by areas specified by the unemployment rate, %
Change in the support for the parties in the Municipal elections 2017 by areas specified by the unemployment rate, %
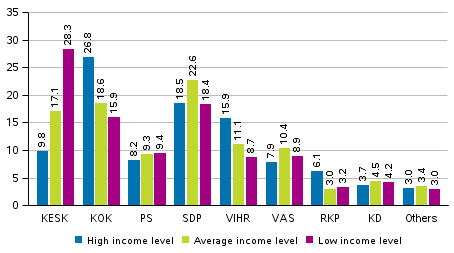
Support for the Centre Party was highest in areas with low income levels. This is explained by the fact that the areas where the party is strong, agriculture-dominated and sparsely populated areas, the income level is lower than average. The support profiles of the Coalition Party and the Green League are also similar in terms of this indicator, support is highest in areas with a high income level. The Social Democratic Party and the Left Alliance collected support in areas of an average income level, while support for the Finns Party focused on areas with a slightly lower income level.
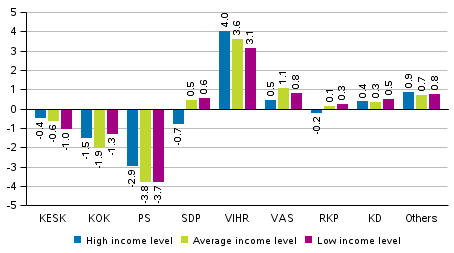
The Centre Party lost most support in areas with a low income level, the support for the Finns Party decreased most in areas of low and average income levels. In relative terms, the Coalition Party lost most support in areas with average income levels and the Social Democratic Party in high income level areas. In areas with average or low income levels, the Social Democratic Party managed to improve it support. Support for the Green League increased in all areas, most, in relative terms, in high income level areas.
Support for the parties in the Municipal elections 2017 by areas specified by the income level, %
Change in the support for the parties in the Municipal elections 2017 by areas specified by the income level, %
Statistics Finland's election result services
Before the elections, Statistics Finland released a review on 31 March 2017 on the background of municipal election candidates analysing the candidates' sex distribution, age, origin, education, employment, income level and family status in comparison to persons entitled to vote. The review will be updated on 27 April 2017 with background data on the elected councillors.
On 11 April 2017, Statistics Finland opened a free of charge election map service on the web containing data illustrated by maps and charts on the Municipal elections. The themes include voting turnout, the party with the most votes and support for parties and change in the support and the proportion of young, female and new councillors. The data can be browsed by various area categories such as municipalities, constituencies and the largest towns by voting district. The map data will be updated with the confirmed election results on 21 April 2017.
More detailed election result data are available in Statistics Finland's PX-Web database service where users can compile customised statistical tables on the elections. Database tables on the preliminary Municipal election data will be produced on 11 April 2017. Database tables according to the confirmed results of the Municipal elections will be released on 21 April 2017.
Source: Municipal Elections 2017, confirmed result, Statistics Finland
Inquiries: Sami Fredriksson 029 551 2696, Jaana Asikainen 029 551 3506, vaalit@stat.fi
Director in charge: Jari Tarkoma
Publication in pdf-format (449.4 kB)
- Tables
-
Tables in databases
Pick the data you need into tables, view the data as graphs, or download the data for your use.
Appendix tables
- Quality descriptions
-
- Municipal elections, quality description (21.4.2017)
Updated 21.4.2017
Official Statistics of Finland (OSF):
Municipal elections [e-publication].
ISSN=2323-1114. preliminary data 2017. Helsinki: Statistics Finland [referred: 20.4.2025].
Access method: http://stat.fi/til/kvaa/2017/03/kvaa_2017_03_2017-04-21_tie_001_en.html

