Published: 15 September 2016
Current account in deficit in the second quarter, the value of exports continued falling
The current account was EUR 1.6 billion in deficit in the second quarter of 2016. The combined value of exports of goods and services compared with the corresponding period in 2015 now declined for the fourth successive quarter. In July, the decline continued as the value of exports of goods and services decreased by eight per cent. Both foreign assets and liabilities contracted in the second quarter. The net international investment position was positive. The data appear from Statistics Finland's statistics on balance of payments and international investment position.
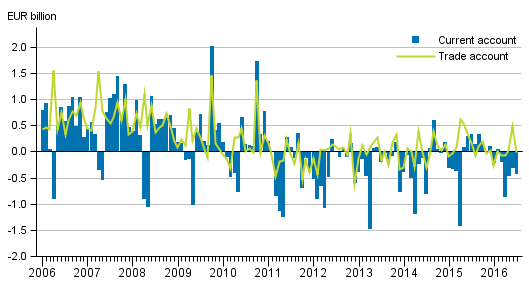
Current account and trade account

Current account in the second quarter
The current account was EUR 1.6 billion in deficit in the second quarter of the year. The deficit was generated from the services, primary and secondary income accounts.
In balance of payment terms, the trade account was EUR 0.4 billion in surplus. The value of exports of goods in balance of payment terms declined by three per cent from the corresponding period one year ago and amounted to EUR 13.9 billion. The value of imports of goods in balance of payment terms grew by five per cent from the corresponding period one year ago and amounted to EUR 13.4 billion.
The services account showed a deficit of EUR 0.8 billion. The value of service exports decreased by four per cent from the second quarter of 2015 and was EUR 5.2 billion. The value of service imports declined by one per cent.
The primary income account was EUR 0.8 billion in deficit, which is mainly explained by the deficit of investment income. The primary income account includes investment income like interests and dividends. The secondary income account was EUR 0.4 billion in deficit.
Export and import figures in balance of payments terms by service item and area can be found in the statistics on international trade in goods and services .
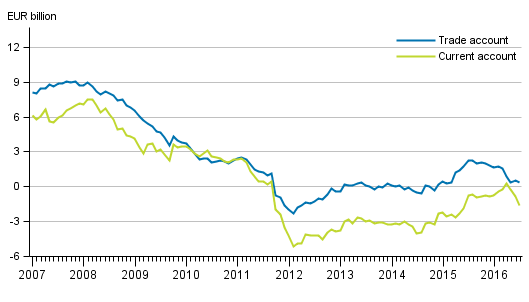
Current account in July
In July, the current account was EUR 0.4 billion in deficit. Of the sub-items of the current account, the services account, the primary income account and the secondary income account were in deficit. In balance of payment terms, the trade account was in balance. The value of exports of goods in balance of payment terms declined by 11 per cent and that of exports of services by one per cent year-on-year. The value of exports of goods in balance of payment terms decreased by seven per cent from twelve months back.
Current account and trade account, 12 –month moving sum

Financial account and net international investment position
Net capital outflow from Finland, the net international investment position strengthened
In the second quarter of 2016, net capital outflow from Finland amounted to EUR 3.6 billion. Capital inflow was mostly in the form of other investments, that is, for example, as loans, deposits and trade credits from outside the group, EUR 6.6 billion on net. Net capital outflow from Finland was mostly in the form of direct investment, EUR 6.5 billion. At the end of the second quarter of 2016, Finland had EUR 735.9 billion in foreign assets and EUR 731.9 billion in foreign liabilities.
Table 1. External assets and liabilities by investment type, EUR billion
| Opening position 31.03.2016 | Financial transactions 2016 Q2 | Price changes 2016 Q2 | Changes in the exchange rates and valuation adjustments 2016 Q2 | Closing position 30.06.2016 | |
| Financial account | -0.5 | 3.6 | 2.1 | -1.2 | 4.0 |
| Assets | 752.0 | -36.2 | 21.0 | -0.9 | 735.9 |
| Liabilities | 752.5 | -39.7 | 19.0 | 0.1 | 731.9 |
| Direct investment | 25.5 | 6.5 | -0.8 | 0.0 | 31.2 |
| Assets | 146.4 | -4.1 | -0.8 | -0.7 | 140.8 |
| Liabilities | 120.9 | -10.6 | 0.0 | -0.6 | 109.7 |
| Portfolio investment | -11.1 | 1.1 | 2.0 | 0.1 | -7.9 |
| Assets | 292.9 | -3.1 | 2.1 | 0.8 | 292.7 |
| Liabilities | 304.0 | -4.2 | 0.1 | 0.7 | 300.6 |
| Other investment | -26.2 | -6.6 | 0.0 | -0.2 | -33.0 |
| Assets | 194.8 | -9.0 | 0.0 | 0.1 | 185.9 |
| Liabilities | 220.9 | -2.4 | 0.0 | 0.3 | 218.8 |
| Financial derivatives | 2.1 | 2.1 | 0.0 | -0.5 | 3.7 |
| Reserve assets | 9.1 | 0.4 | 0.2 | 0.3 | 10.0 |
Direct investment liabilities decreased more than assets
At the end of the second quarter of 2016, foreign direct investment assets on gross stood at EUR 140.8 billion and the corresponding liabilities at EUR 109.7 billion. During the second quarter of 2016, foreign direct investment assets decreased by EUR 5.6 billion and liabilities by EUR 11.2 billion. The drop is explained by changes in intra-group loans and trade credits. During the second quarter, these debt assets decreased by EUR 5.3 billion and the corresponding liabilities declined by EUR 8.1 billion.
Portfolio investment liabilities contracted
In the second quarter, foreign portfolio investments decreased by EUR 3.1 billion on net. Holding gains (the effect of changes in prices, exchange rates and other valuation changes) from foreign portfolio investments totalled EUR 2.9 billion in the second quarter. At the end of the second quarter of 2016, outward portfolio investment assets stood at EUR 292.7 billion, of which EUR 145.7 billion were investments in shares and mutual fund shares, and EUR 147.0 billion in bonds and money market instruments.
At the end of the second quarter, outward portfolio investment liabilities stood at EUR 300.6 billion, of which EUR 101.5 billion were investments in shares and mutual fund shares, and EUR 199.1 billion in bonds and money market instruments. In the second quarter, portfolio investment liabilities contracted by EUR 3.4 billion when also considering holding gains. Changes in prices increased portfolio investment liabilities by EUR 0.1 billion and other valuation changes by EUR 0.7 billion.
Net investment position related to other investments weakened
In the second quarter of 2016, net capital inflow to Finland of other investments, i.e. loans, deposits and trade credits amounted to EUR 6.6 billion. The net investment position related to other investments weakened by EUR 6.8 billion, when also considering the EUR 0.7 billion effect of price changes and the EUR -0.9 billion effect of other valuation changes. At the end of June, assets from other investments amounted to EUR 185.9 billion and liabilities to EUR 218.8 billion. Of these assets, EUR 164.5 billion and of the liabilities, EUR 189.4 billion were held by financial and insurance corporations.
Derivative-related investment portfolios declined
At the end of June, Finland had EUR 3.7 billion derivative-related net assets, which is EUR 1.6 billion more than at the end of March. Both derivative-related assets and liabilities contracted in the second quarter.
Net international investment position strengthened
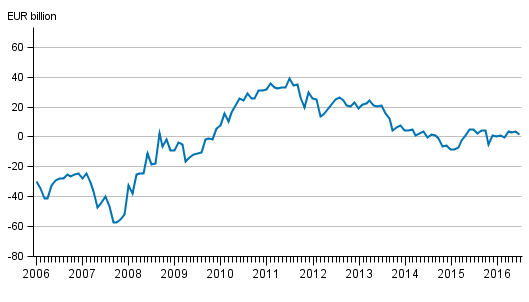
At the end of June 2016, Finland had EUR 735.9 billion in foreign assets and EUR 731.9 billion in foreign liabilities. The net international investment position was thus positive at the end of the quarter as there were EUR 4.0 billion more assets than liabilities. Both foreign assets and liabilities contracted in the second quarter. Price changes related to foreign assets and liabilities raised the net investment position by EUR 2.1 billion during the quarter. Changes in exchange rates and other valuation changes in turn lowered the net investment position by EUR 1.2 billion.
At the end of March 2016, the net investment position was EUR 0.5 billion negative so the net growth was EUR 4.5 billion. Assets declined by EUR 16.1 billion in April to June and liabilities by EUR 20.7 billion. When examining the net investment position at sector level, the foreign assets of mutual funds, social security funds and households were higher than their liabilities. Non-financial corporations, monetary financial institutions, central government and local government had more foreign liabilities than assets.
Financial account and international investment position in July
In July, the net capital inflow to Finland was EUR 2.4 billion. Net capital inflow was mostly in the form of portfolio investments, altogether EUR 2.5 billion. Net capital outflow was mostly in the form of direct investments, EUR 0.6 billion.
Finland's net investment position was EUR 1.7 billion positive at the end of July, as foreign assets amounted to EUR 754.3 billion and foreign liabilities to EUR 752.6 billion.
The data for August will be published on 14 October 2016.
International investment position monthly

Source: Balance of payments and international investment position, Statistics Finland
Inquiries: Tapio Kuusisto 029 551 3318, Saana Ranta-Ruona 029 551 3375, balanceofpayments@stat.fi.
Director in charge: Ville Vertanen
Publication in pdf-format (303.0 kB)
- Tables
-
Tables in databases
Pick the data you need into tables, view the data as graphs, or download the data for your use.
Appendix tables
- Appendix table 1. Current account, quarterly, EUR million (15.9.2016)
- Appendix table 2. External assets and liabilities by sector, quarterly, EUR million (15.9.2016)
- Appendix table 3. International investment position by sector, quarterly, EUR million (15.9.2016)
- Appendix table 4. Balance of payments, EUR million (15.9.2016)
Updated 15.9.2016
Official Statistics of Finland (OSF):
Balance of payments and international investment position [e-publication].
ISSN=2342-348X. July 2016. Helsinki: Statistics Finland [referred: 20.4.2025].
Access method: http://stat.fi/til/mata/2016/07/mata_2016_07_2016-09-15_tie_001_en.html

