Gross domestic product fell by 2.9 per cent in 2020
The volume of gross domestic product contracted by 2.9 per cent last year. Calculated at current prices, gross domestic product was 1.3 per cent lower than in 2019. In October to December, gross domestic product grew by 0.4 per cent from the previous quarter but remained 1.4 per cent lower than one year earlier.
According to preliminary data compiled by Eurostat, GDP in the EU area contracted by 0.4 per cent in the last quarter from the level in July to September and by 6.4 per cent in the whole of 2020.
Figure 1. Volume change of GDP from the previous quarter, seasonally adjusted, per cent
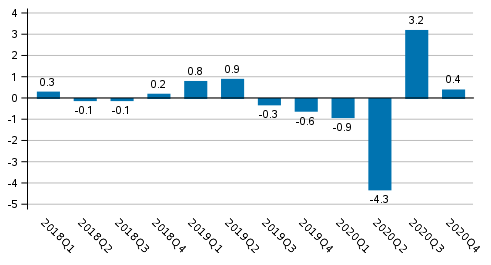
The downturn in Finland's national economy, which started already in mid-2019, continued in 2020. At the beginning of the year, the economy was already in recession and the views became even gloomier as the coronavirus pandemic spread globally. The restrictive measures and recommendations imposed to prevent the spread of the pandemic, as well as uncertainty about the future, hit especially the service industries and international trade in the second quarter. Recovery from the worst trough could be seen in the third quarter, but also in the last quarter GDP remained at a lower level than in 2018 and 2019.
The data in this publication on gross domestic product are based on value added generated by various industries, which remains after deducting the inputs used to produce them from the goods and services produced. Quarterly national accounts data are principally based on data on enterprises' turnover. By contrast, very little data is available on enterprises' expenditure. Because the ratio between enterprises' expenditure and turnover may deviate considerably from the normal in the coronavirus year 2020, the estimate on GDP development is more uncertain than usual. Another structural change increasing uncertainty has been caused by educational services and health care services preparing to treat infections and prevent the spread of the pandemic. In the assessment of health care services, data from the National Institute for Health and Welfare have been utilised to examine the number of measures taken, when resources have been transferred from planned measures to ensuring intensive care preparedness.
Output
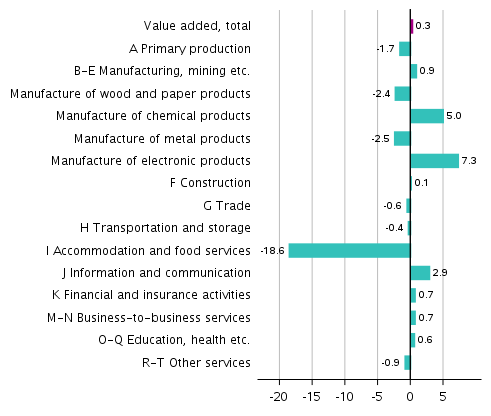
In the fourth quarter, the combined volume of value added generated by industries grew by 0.3 per cent from the previous quarter. In the whole of 2020, value added was 2.9 per cent lower than in the year before.
Among manufacturing industries, only the electronic and electrical industry grew in 2020. Service industries also developed weakly, and for transportation and storage and accommodation and food service activities the coronavirus year was catastrophic.
Figure 2. Changes in the volume of value added generated by industries in 2020 compared to the previous year, per cent
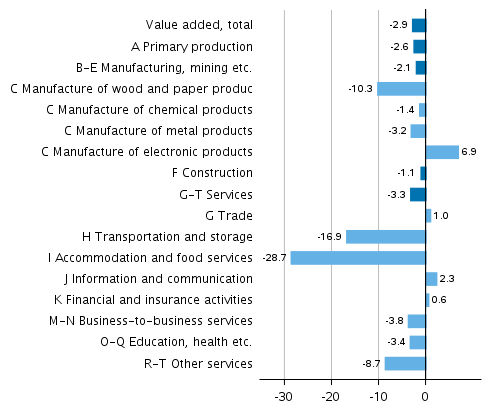
Figure 3. Changes in the volume of value added generated by industries in the fourth of 2020 compared to one year ago, working-day adjusted, per cent
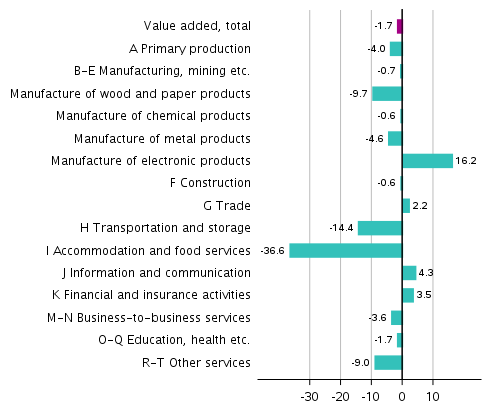
Figure 4. Changes in the volume of value added generated by industries in the fourth quarter of 2020 to the previous quarter, seasonally adjusted, per cent
The volume of value added in primary production, that is, agriculture, forestry and fishery, declined by four per cent in October to December from one year ago. In the whole of 2020, primary production decreased by three per cent.
Value added in manufacturing (industries B to E) decreased by two per cent in 2020 and in the last quarter by one per cent compared to the previous year. In 2020, the volume of the metal industry diminished by three per cent, the chemical industry by one per cent and the forest industry by as much as 10 per cent. The electronic and electrical industry increased by seven per cent.
The volume of value added in construction fell in October to December by one per cent from the year before, as in the whole of 2020. In building construction, the trend has been falling already since 2018, but civil engineering grew in 2020.
From October to December, the volume of value added in service industries decreased by two per cent from the quarter of the previous year. In the whole of 2020, value added in service industries fell by three per cent. The industries that were hit hardest by the coronavirus pandemic were transportation and storage, where value added declined by around one-sixth from the previous year in 2020, and accommodation and food service activities, where nearly one-third of the value added disappeared.
Imports, exports, consumption and investments
In 2020, total demand in the national economy contracted by four per cent from the previous year. Other demand items diminished clearly but government consumption expenditure grew marginally.
Figure 5. Changes in the volume of main supply and demand items in 2020 compared to the previous year, per cent
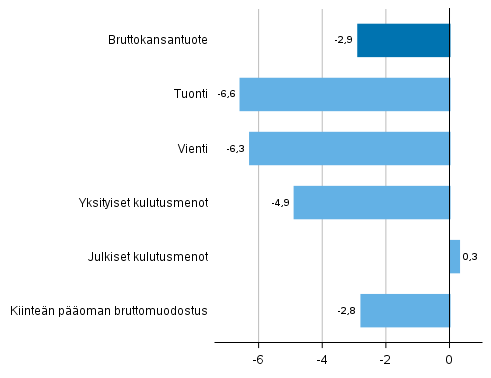
Figure 6. Changes in the volume of main supply and demand items in the fourth quarter of 2020 compared to the previous year, working day adjusted, per cent
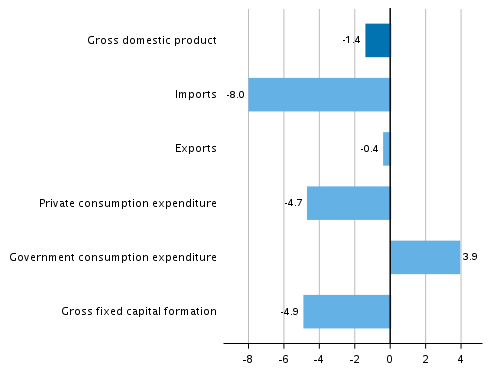
Figure 7. Changes in the volume of main supply and demand items in the fourth quarter of 2020 compared to the previous quarter, seasonally adjusted, per cent
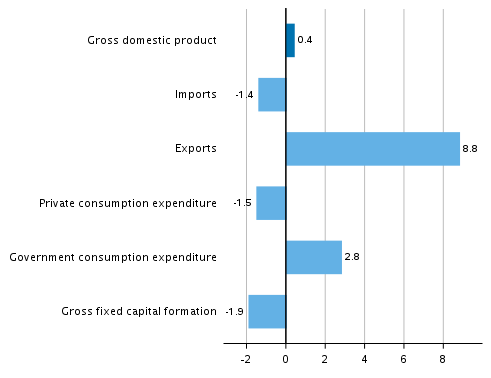
From October to December, the volume of exports increased by nine per cent from the previous quarter. Ship delivery increased exports of goods, which grew by seven per cent. Both exports and imports of services have remained lower than in the previous year since the second quarter. Imports of goods also decreased, especially in the second quarter. In the whole of 2020, the volume of exports decreased by six per cent and that of imports by seven per cent. The corresponding changes at current prices were -11 per cent and -12 per cent due to lower prices of international trade in goods.
Private consumption remained on a lower level in every quarter of 2020 compared to the previous year. In the whole year, private consumption expenditure decreased by five per cent. Consumption of semi-durable goods and services was particularly weak as people purchased accessories and used services clearly less than in the year before. By contrast, the consumption of non-durable goods grew throughout the year as people ate at home instead of in restaurants.
Government consumption expenditure increased in October to December. In the whole of 2020, the volume of government consumption expenditure went up by 0.3 per cent.
From October to December, the volume of gross fixed capital formation, that is, investments, contracted as it did in the previous quarters. Over the whole year, investments decreased by three per cent. Of investment items, only investments in civil engineering grew. In 2020, private investments decreased by five per cent, but public investments grew by eight per cent from the previous year.
Employment, wages and salaries and national income
In October to December, the number of employed persons was 0.6 per cent higher than in the previous quarter. The number of hours worked in the national economy decreased by 0.9 per cent from the previous quarter. In 2020, the number of employed persons decreased by 1.5 per cent and the number of hours worked by 2.0 per cent from the year before. According to Statistics Finland's Labour Force Survey, the unemployment rate was 7.4 per cent in October to December, having been 6.0 per cent in the year before. In the whole of 2020, the unemployment rate was 7.8 per cent, having been 6.7 per cent in the year before.
Labour productivity, or the volume of gross value added per hour worked, decreased by 0.9 per cent last year.
The nominal wages and salaries bill of the national economy grew by 0.4 per cent in October to December from the previous quarter. Over the whole year, the wages and salaries bill decreased by 0.4 per cent. Social contributions paid by employers decreased by 1.1 per cent from the previous quarter and by 1.2 per cent in the whole year.
The operating surplus (net), which in business bookkeeping corresponds roughly with operating profit, decreased by 0.4 per cent in 2020. Gross national income was 0.7 per cent lower in nominal terms than in the previous year.
The available data
The preliminary data are based on the source information on economic development available on 19 February 2021. The annual level data for 1990 to 2019 correspond with the National Accounts data released on 26 February 2021. Statistics Finland and Eurostat assess the processing of primary income received from the rest of the world by employment pension schemes. The possible correction will be made as soon as possible and it would affect the data for 2017 to 2020.
The preliminary data for 2020 that contain more detailed data on general government and other sector accounts will be released on 15 March 2021. The revised data will also be updated in the database tables of the Quarterly National Accounts but no actual statistical release of the Quarterly National Accounts will be compiled.
National Accounts for 2020 with more detailed data contents will be released on 23 June 2021.
National accounts data concerning the first quarter of 2021 will be released on 28 May 2021, when the data for previous quarters will also be revised. A flash estimate on GDP development for January to March will be released in connection with the Trend Indicator of Output on 18 May 2021.
The quality description is available on Statistics Finland's website: http://www.tilastokeskus.fi/til/ntp/laa.html .
Methodological description of Quarterly National Accounts.Source: National Accounts 2020, 4th quarter. Statistics Finland
Inquiries: Samu Hakala 029 551 3756, Antti Kosunen 029 551 3613, kansantalous.suhdanteet@stat.fi
Head of Department in charge: Katri Kaaja
Updated 26.02.2021
Official Statistics of Finland (OSF):
Quarterly national accounts [e-publication].
ISSN=1797-9765. 4th quarter 2020,
Gross domestic product fell by 2.9 per cent in 2020
. Helsinki: Statistics Finland [referred: 19.4.2025].
Access method: http://stat.fi/til/ntp/2020/04/ntp_2020_04_2021-02-26_kat_001_en.html

